
Most traders test Polymarket VPS latency wrong. They ping an endpoint, see a low number, and assume that is their execution speed. But a ping is not an order. An ICMP echo tells you nothing about how long your market data takes to arrive, your code takes to react, and your order takes to reach the matching engine and come back. By the time that round trip finishes, the price you saw may already be gone.
This guide shows you how to test the latency of a Polymarket VPS the way a bot operator should: by measuring the path that actually decides your fills, from market signal to order confirmation. It covers what latency means for a prediction market, the phases that add milliseconds, the statistics that matter, the endpoints a real bot touches, four ways to measure them, a complete Python probe you can run today, and two locations of real measured results with the awkward parts left in.
One scoping note before any number: this guide assumes you trade Polymarket through the API. As of July 2026, Ireland and the Netherlands both sit in Polymarket’s frontend-restricted group, so the polymarket.com website is close-only from either country while the CLOB API is unrestricted in both. That split trips people up during testing, because the geoblock endpoint runs on polymarket.com: it returns blocked: true from both locations, and it is reporting the website, not the API your bot talks to. Restriction groups are set by Polymarket and regulators, they have moved more than once this year, so verify against Polymarket’s own geoblock reference before you provision. The full jurisdiction picture, and which city fits which strategy, lives in our Dublin vs Amsterdam comparison.
How to test Polymarket VPS latency: the short version
- A ping is not your trading latency. The numbers that matter are the warm round-trip on the order path and the WebSocket message latency.
- Read the tail and the jitter, not just the median. One slow order in fifty is what costs money, and two boxes with identical medians can behave completely differently at p99.
- Run it more than once. In the results below, the faster box on the order path changed between two runs of the same script on the same machines. A single run is a coin flip presented as a finding.
- Probe every venue your strategy touches, not only Polymarket. The largest gap we measured was on a path almost nobody tests.
- Test from the box you will trade from, at the same time of day as anything you compare it against.
What latency actually means for a Polymarket bot
Latency, for a trader, is the time between a market event happening and your order acting on it. It is not a single number, it is a chain of delays, and your VPS only controls some of them. Three layers, and separating them is how you attribute a problem correctly.
Layer 1, network latency. The time for a packet to travel from your VPS to Polymarket’s infrastructure and back. This is the layer your provider and its routing control, and it is the focus of most of this guide.
Layer 2, application latency. The time for your own code to receive data, deserialize it, decide, and serialize an order. Entirely on your side. A tight event-driven bot does this in single-digit milliseconds; one with a blocking call or a database query in the hot path can add hundreds. Single-threaded runtimes are bound by CPU clock speed here, which is why per-core speed matters more than core count for a trading bot.
Layer 3, execution latency. The time for Polymarket’s CLOB to receive your order, match it, and confirm. You cannot control this, and you need to know it exists, because during a high-volume event it stretches as the engine works through the queue.
And one more for on-chain work. Polymarket settles on Polygon. Order placement does not wait for a block, but if your strategy reads chain state or touches settlement inside a loop that matters, that path has its own latency and it belongs in your test.
The mistake most traders make is testing only Layer 1, testing it badly, then blaming the VPS for what is actually Layer 2.
Who fixes which part
Every millisecond between a market move and your fill belongs to one of three owners, and knowing which is which tells you where a problem can actually be fixed.
What the VPS decides. The network path and routing quality to the edge your bot reaches, CPU clock speed, and how much your latency varies under load. From a well-placed European box this whole bucket is a few milliseconds.
What your code decides. Connection reuse, an event-driven WebSocket loop instead of REST polling, efficient strategy logic, fast JSON parsing, and no blocking calls in the hot path. This is usually the largest and most variable slice, and no VPS rescues slow code.
What nobody fixes. Polymarket’s own server processing time, the speed-of-light minimum for the distance involved, Polygon’s block time, and the engine slowdown during a busy event. This floor is shared by every trader connecting from the same place. You cannot change it, only design around it.
The strategic point falls straight out: you compete on the first two buckets only. The third is identical for everyone, which is why the winner is not whoever advertises the lowest single number, it is whoever is fast and consistent in the parts they control.
The connection phases behind a Polymarket VPS latency test
When your bot makes its first request to a Polymarket endpoint, several things happen in sequence before you get a single byte back. A bare ping skips all of them.
TCP connect. Opening the connection, after the hostname has been resolved. This is the cleanest proxy for raw network distance, because it is essentially one round trip with nothing else mixed in. From a well-placed European box, expect roughly 0.5 to 1.5 ms to the Polymarket edge. A steady 10 ms or more suggests your traffic is reaching a distant edge, which is a routing question rather than a code one.
TLS handshake. Negotiating encryption, one to two extra round trips plus cryptographic work on both ends. Typically 15 to 20 ms from a European box, and at these distances most of that is processing rather than travel, which is why two boxes with different network distances often land on nearly identical TLS times. The important part: this cost is paid once per connection. A bot that reuses a connection pays it once; a bot that opens a fresh connection per request pays it on every single order.
TTFB. Time from sending your request to receiving the first byte, which includes one round trip plus Polymarket’s own processing. Most of it is the server side, and it is identical for every provider.
Cold versus warm: the distinction that changes everything
A cold request pays the full sequence: name resolution, TCP, TLS, then TTFB. A warm request reuses an already-open, already-encrypted connection, so it pays only the round trip plus server time.
The gap is large. A cold request to the order book can total 80 ms or more, while the same request on a warm pooled connection lands around 22.
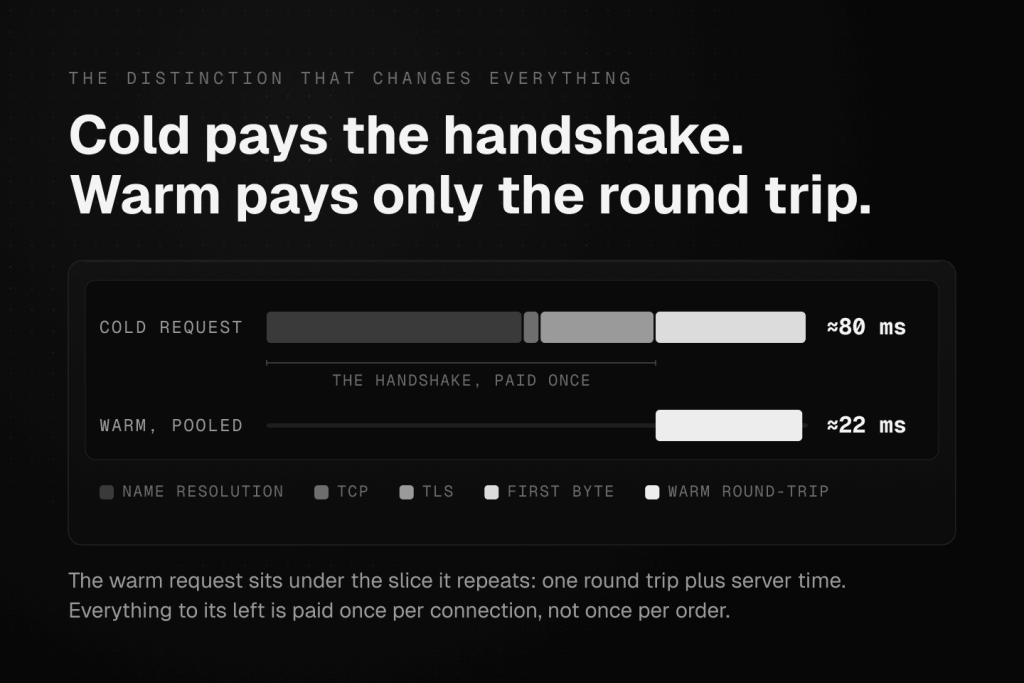
This matters because a real trading bot keeps its connections open. It holds a pooled connection to the CLOB and a long-lived WebSocket for market data. The warm number is the one that reflects your actual trading latency, and the cold number, which many simple tools report as “your latency,” dramatically overstates it. Any benchmark that does not separate the two is misleading you, and this is the main reason a quick command-line check is not enough to make a decision on.
Reading the numbers: p50, p95, p99, max and jitter
Run a latency test fifty times and you get fifty different numbers. Reporting their average is one of the most common mistakes in trading infrastructure, because the average hides exactly the events that cost money.
- p50 (median). Half your requests are faster, half slower. Your typical latency.
- p95. Ninety-five percent finish within this. Where the tail starts showing.
- p99. The tail that bites during real trading: one slow order in a hundred.
- max. The single worst request in the run. Useful for spotting outliers that the percentiles smooth over.
- jitter (standard deviation). How spread out the numbers are. Two boxes can share a median and behave completely differently.
The practical rule: a fast median with a tight tail beats a slightly faster median with a loose tail. A profile of p50 22 ms, p99 45 ms, jitter 6 ms is good. A profile of p50 20 ms, p99 300 ms, jitter 40 ms is dangerous, even though the median looks better, because one order in a hundred stalls for a third of a second and it will happen exactly when the market is moving.

One subtlety worth knowing before you read the results below: jitter and p99 can disagree. Standard deviation is driven by the bulk of your samples, while p99 is driven by the rare worst ones. A box can be more consistent most of the time and still have a worse occasional spike than its rival. Both numbers are telling you something real, and which one matters more depends on whether your strategy is hurt by steady noise or by rare stalls.
And when you compare two boxes, make sure both runs happened at the same time. Market activity inflates tails, so a quiet-hour run always flatters a box against a busy-hour run regardless of the hardware. This is the single biggest source of misleading provider comparisons, including honest ones.
The endpoints a real Polymarket bot actually touches
A real bot does not talk to one server, and a complete test measures all of them, because a delay in any one can hurt you.
CLOB, the order book and order submission (trade-critical). https://clob.polymarket.com. Where you read the book and post or cancel orders. Test it against a live token’s order book so the request reaches the origin rather than a cached edge.
WebSocket market channel, the real-time feed (trade-critical). This is how your bot sees the book move. For most strategies it is the single most important path, because it decides how current your view of the market is. Measure it with a PING/PONG round-trip on a live connection, not just the time to open the socket.
Relayer, gasless on-chain operations. The relayer sponsors gas for proxy and Safe wallet transactions: deployment, token approvals, splits, merges and redemptions. Orders never touch it, because CLOB orders are signed messages and gasless by design, so it is not on your order path. Probe it if your bot automates approvals or redemptions.
Gamma API, market metadata. Market definitions, events and token IDs. Not on the hot path, but your bot reads it.
Data API, positions and history. Not latency-critical, worth checking for reachability.
Polygon RPC, the settlement chain. Allowance checks and on-chain reads. The public RPC is rate-limited and unreliable, and in our own benchmarking it produced multi-second spikes and intermittent errors, so use a paid endpoint if your strategy makes chain calls. As the results below show, this path also produced the largest difference between our two locations, and almost nobody measures it.
A reference venue, if your strategy uses one. Many strategies price Polymarket off an external market. That path is worth measuring from the same box, and the results below explain why.
A test that only checks the CLOB misses the relayer, the chain, the feed, and your signal source. The probe below measures all of them in a single run.
Four ways to test Polymarket VPS latency
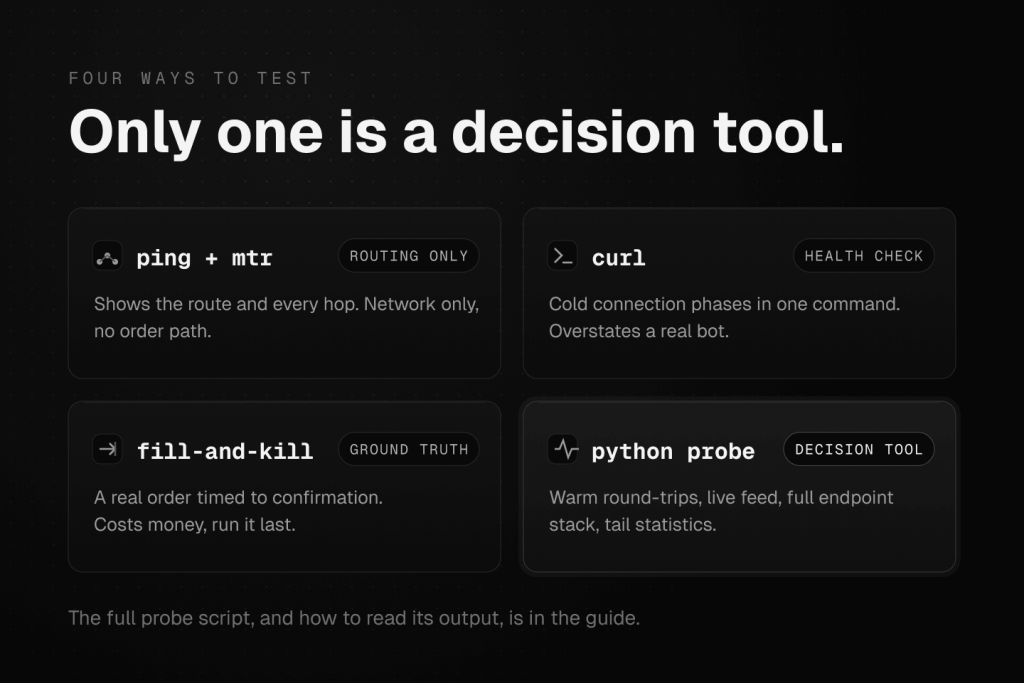
Four practical methods. They measure different things and they are complementary, but they are not equal. (If you want a zero-install first look before any of them, our live latency checker gives you a quick read; the methods below are the full measurement you make a decision on.) At a glance:
| Method | What it measures | Warm or cold | Decision-grade? |
|---|---|---|---|
| ping and mtr | Network route, per-hop latency | Neither (ICMP) | No, routing diagnosis only |
| curl | Cold connection phases (TCP, TLS, TTFB) | Cold only | No, quick health check |
| Fill-and-kill order | Full round trip including matching | Warm | Yes, final validation with real money |
| Python probe | Warm round-trips, WebSocket feed, full endpoint stack, tail statistics | Both, separated | Yes, the comparison tool |
Method 1: ping and mtr, the routing test
ping gives a round-trip number. mtr is far more useful, showing every hop between your box and the destination with latency and packet loss at each:
mtr -rwzbc 30 clob.polymarket.com
This is the only method that tells you why your network latency is what it is. If you run it from a European box and see a detour through another city before reaching the destination, you have found a routing inefficiency that is the provider’s to fix, not something you can change in code.
Limitation: it measures the network only, not your application or the order round-trip, and ICMP is often de-prioritised by routers, so an intermediate hop showing high latency or loss is frequently a measurement artifact. Trust the destination hop.
Use it for: diagnosing routing and distance.
Method 2: curl, the quick health check
curl -w "TCP: %{time_connect}s TLS: %{time_appconnect}s TTFB: %{time_starttransfer}s\n" -o /dev/null -s https://clob.polymarket.com/
Genuinely useful as a fast, zero-dependency sanity check: is this box reaching everything, and roughly how far away is it? It runs anywhere curl exists, which is everywhere.
Two limitations make it the wrong basis for a real decision. It is cold only, because every invocation is a fresh process with a new connection, so it always pays the full handshake and systematically overstates your trading latency. And it cannot speak WebSocket, so it can time the socket opening but not the message round-trip, which is the most important path for most bots.
Use it for: quick health checks. Do not make a provider decision on its numbers alone.
Method 3: authenticated fill-and-kill order, the ground truth
Placing a real FAK order and timing it to confirmation is the only method that captures network, application and matching engine together. It is the ground truth your live trading will experience.
Limitations: it requires authenticated API access, it involves real money, and it is slower to run.
Use it for: final validation before going live with size.
Method 4: the Python probe, the right tool for decisions
This measures everything that matters properly: the cold phase breakdown and the warm pooled round-trip, a real WebSocket PING/PONG, large-sample statistics with p50 through p99 and jitter, and the whole endpoint stack in a single run.
Why Python is the right tool here:
- It can hold a persistent connection and measure the warm round-trip, the number a real bot actually sees, which a shell one-liner cannot.
- It can open a real WebSocket, subscribe to the market channel, and time PING/PONG round-trips, capturing the single most important path for live trading.
- It collects hundreds of samples over a sustained run and computes p50 through p99, max and jitter, so the tail statistics are trustworthy rather than resting on one or two samples.
- It probes the whole stack (CLOB, WebSocket, relayer, Gamma, Data API, Polygon RPC and a reference venue) in one pass, with POST support for the chain RPC.
It needs Python, which every Linux box has, and one small package for the WebSocket test. That is the entire cost, and in exchange you get numbers you can base a decision on.
The Polymarket VPS latency benchmark script
Save this as latency.py on the VPS you want to test. It is self-contained and measures the cold breakdown, the warm pooled round-trip, the WebSocket PING/PONG, and full statistics for every endpoint a real Polymarket bot uses.
#!/usr/bin/env python3

import argparse
import json
import math
import os
import socket
import ssl
import statistics
import sys
import time
from datetime import datetime, timezone
from urllib.parse import urlsplit
import urllib.request

USER_AGENT = "pm-latency-probe/3.0"

# ----------------------------------------------------------------------------
# Endpoint configuration
# ----------------------------------------------------------------------------

# Polygon RPC: use Infura if a key is supplied, else the public RPC.
# eth_blockNumber is a cheap POST that reaches the chain node.
INFURA_KEY = os.environ.get("INFURA_KEY", "").strip()
if INFURA_KEY:
    POLYGON_URL = f"https://polygon-mainnet.infura.io/v3/{INFURA_KEY}"
    POLYGON_NAME = "polygon_rpc_infura"
else:
    POLYGON_URL = "https://polygon-rpc.com/"
    POLYGON_NAME = "polygon_rpc_public"
POLYGON_BODY = '{"jsonrpc":"2.0","method":"eth_blockNumber","params":[],"id":1}'

# group: pm = Polymarket | chn = settlement chain | ref = reference market
# critical = trade hot path (highlighted in the decision summary)
REST_ENDPOINTS = [
    {"name": "clob_root",     "url": "https://clob.polymarket.com/",     "method": "GET",  "body": None,         "critical": True,  "group": "pm"},
    {"name": "clob_book",     "url": "https://clob.polymarket.com/book", "method": "GET",  "body": None,         "critical": True,  "group": "pm"},
    {"name": "clob_markets",  "url": "https://clob.polymarket.com/markets", "method": "GET", "body": None,       "critical": True,  "group": "pm"},
    {"name": "relayer_nonce", "url": "https://relayer-v2.polymarket.com/nonce?address=0x0000000000000000000000000000000000000000&type=SAFE", "method": "GET", "body": None, "critical": False, "group": "pm"},
    {"name": "gamma_events",  "url": "https://gamma-api.polymarket.com/events", "method": "GET", "body": None,   "critical": False, "group": "pm"},
    {"name": "data_trades",   "url": "https://data-api.polymarket.com/trades",  "method": "GET", "body": None,   "critical": False, "group": "pm"},
    {"name": POLYGON_NAME,    "url": POLYGON_URL,                         "method": "POST", "body": POLYGON_BODY, "critical": False, "group": "chn"},
    {"name": "binance_ping",  "url": "https://api.binance.com/api/v3/ping", "method": "GET", "body": None,       "critical": False, "group": "ref"},
]

WS_MARKET_URL = "wss://ws-subscriptions-clob.polymarket.com/ws/market"
SAMPLING_MARKETS_URL = "https://clob.polymarket.com/sampling-markets"
MARKETS_URL = "https://clob.polymarket.com/markets"


# ----------------------------------------------------------------------------
# Stats helpers
# ----------------------------------------------------------------------------

def percentile(values, p):
    """Linear-interpolated percentile. p in [0,1]."""
    if not values:
        return None
    s = sorted(values)
    if len(s) == 1:
        return s[0]
    k = (len(s) - 1) * p
    f = math.floor(k)
    c = math.ceil(k)
    if f == c:
        return s[int(k)]
    return s[f] * (c - k) + s[c] * (k - f)


def summarize(values, errors):
    n_ok = len(values)
    total = n_ok + errors
    if not values:
        return {"samples": total, "ok": 0, "errors": errors,
                "error_rate": round(errors / total, 4) if total else None,
                "min_ms": None, "mean_ms": None, "p50_ms": None, "p90_ms": None,
                "p95_ms": None, "p99_ms": None, "max_ms": None, "stdev_ms": None}
    r = lambda x: round(x, 3) if x is not None else None
    return {
        "samples": total,
        "ok": n_ok,
        "errors": errors,
        "error_rate": round(errors / total, 4) if total else 0.0,
        "min_ms":  r(min(values)),
        "mean_ms": r(statistics.fmean(values)),
        "p50_ms":  r(percentile(values, 0.50)),
        "p90_ms":  r(percentile(values, 0.90)),
        "p95_ms":  r(percentile(values, 0.95)),
        "p99_ms":  r(percentile(values, 0.99)),
        "max_ms":  r(max(values)),
        "stdev_ms": r(statistics.pstdev(values)) if n_ok > 1 else 0.0,  # jitter
    }


# ----------------------------------------------------------------------------
# REST: cold connection, phase-by-phase breakdown (GET or POST)
# ----------------------------------------------------------------------------

def probe_rest_cold(url, timeout, method="GET", body=None):
    """
    One cold request with no connection reuse. Returns phase timings (ms) plus
    resolved IP and HTTP status. Supports a JSON POST body (for the Polygon RPC).
    """
    parts = urlsplit(url)
    host = parts.hostname
    port = parts.port or (443 if parts.scheme == "https" else 80)
    path = parts.path or "/"
    if parts.query:
        path += "?" + parts.query
    method = (method or "GET").upper()

    t0 = time.perf_counter()
    infos = socket.getaddrinfo(host, port, type=socket.SOCK_STREAM)
    t_resolve = time.perf_counter()
    family, socktype, proto, _canon, sockaddr = infos[0]
    ip = sockaddr[0]

    raw = socket.socket(family, socktype, proto)
    raw.settimeout(timeout)
    sock = raw
    try:
        # --- TCP ---
        raw.connect(sockaddr)
        t_tcp = time.perf_counter()

        # --- TLS ---
        if parts.scheme == "https":
            ctx = ssl.create_default_context()
            sock = ctx.wrap_socket(raw, server_hostname=host)
        t_tls = time.perf_counter()

        # --- request + TTFB (first byte) ---
        body_bytes = body.encode() if body else b""
        if method == "POST" or body:
            head = (
                f"{method} {path} HTTP/1.1\r\n"
                f"Host: {host}\r\n"
                f"User-Agent: {USER_AGENT}\r\n"
                f"Accept: */*\r\n"
                f"Content-Type: application/json\r\n"
                f"Content-Length: {len(body_bytes)}\r\n"
                f"Connection: close\r\n\r\n"
            ).encode() + body_bytes
        else:
            head = (
                f"{method} {path} HTTP/1.1\r\n"
                f"Host: {host}\r\n"
                f"User-Agent: {USER_AGENT}\r\n"
                f"Accept: */*\r\n"
                f"Connection: close\r\n\r\n"
            ).encode()
        sock.sendall(head)
        first = sock.recv(4096)            # blocks until first packet arrives
        t_ttfb = time.perf_counter()

        try:
            status = int(first.split(b" ", 2)[1])
        except Exception:
            status = None

        while True:                        # drain for a comparable total
            chunk = sock.recv(65536)
            if not chunk:
                break
        t_total = time.perf_counter()
    finally:
        try:
            sock.close()
        except Exception:
            pass

    ms = lambda a, b: (b - a) * 1000.0
    return {
        "resolve_ms": ms(t0, t_resolve),
        "tcp_ms":   ms(t_resolve, t_tcp),
        "tls_ms":   ms(t_tcp, t_tls) if parts.scheme == "https" else 0.0,
        "ttfb_ms":  ms(t_tls, t_ttfb),     # ~1 network RTT + server processing
        "total_ms": ms(t0, t_total),
        "ip": ip,
        "status": status,
    }


# ----------------------------------------------------------------------------
# REST: warm / keep-alive request latency (connection reused)
# ----------------------------------------------------------------------------

class WarmClient:
    """
    Holds one persistent connection and measures the round-trip of a single
    small request on it: what a bot with connection pooling actually
    experiences per request. Reconnects transparently if the server drops it.
    """
    def __init__(self, url, timeout, method="GET", body=None):
        import http.client
        self._http = http.client
        parts = urlsplit(url)
        self.scheme = parts.scheme
        self.host = parts.hostname
        self.port = parts.port or (443 if parts.scheme == "https" else 80)
        self.path = (parts.path or "/") + (("?" + parts.query) if parts.query else "")
        self.timeout = timeout
        self.method = (method or "GET").upper()
        self.body = body
        self.conn = None

    def _connect(self):
        if self.scheme == "https":
            self.conn = self._http.HTTPSConnection(
                self.host, self.port, timeout=self.timeout,
                context=ssl.create_default_context())
        else:
            self.conn = self._http.HTTPConnection(
                self.host, self.port, timeout=self.timeout)
        self.conn.connect()

    def _headers(self):
        h = {"User-Agent": USER_AGENT, "Accept": "*/*", "Connection": "keep-alive"}
        if self.body:
            h["Content-Type"] = "application/json"
        return h

    def request_ms(self):
        if self.conn is None:
            self._connect()
        t0 = time.perf_counter()
        try:
            self.conn.request(self.method, self.path, body=self.body, headers=self._headers())
            resp = self.conn.getresponse()
            resp.read()                    # must fully read to reuse the socket
            return (time.perf_counter() - t0) * 1000.0
        except Exception:
            try:
                self.conn.close()
            except Exception:
                pass
            self.conn = None
            self._connect()
            t1 = time.perf_counter()
            self.conn.request(self.method, self.path, body=self.body, headers=self._headers())
            resp = self.conn.getresponse()
            resp.read()
            return (time.perf_counter() - t1) * 1000.0

    def close(self):
        if self.conn:
            try:
                self.conn.close()
            except Exception:
                pass


# ----------------------------------------------------------------------------
# WebSocket: connect, first message, PING/PONG round-trip
# ----------------------------------------------------------------------------

def _find_token_id(obj):
    """Recursively pull the first token_id out of a CLOB markets JSON blob."""
    if isinstance(obj, dict):
        for k, v in obj.items():
            if k == "token_id" and isinstance(v, (str, int)) and str(v).isdigit():
                return str(v)
            r = _find_token_id(v)
            if r:
                return r
    elif isinstance(obj, list):
        for item in obj:
            r = _find_token_id(item)
            if r:
                return r
    return None


def fetch_live_token_id(timeout):
    """Grab one active token id so /book hits the origin and WS subscribe is valid."""
    for url in (SAMPLING_MARKETS_URL, MARKETS_URL):
        try:
            req = urllib.request.Request(url, headers={"User-Agent": USER_AGENT})
            with urllib.request.urlopen(req, timeout=timeout) as r:
                data = json.loads(r.read().decode())
            tid = _find_token_id(data)
            if tid:
                return tid
        except Exception:
            continue
    return None


def run_ws_probe(url, token_id, ping_count, ping_interval, timeout):
    """
    Returns (connect_ms, first_msg_ms, [ping_rtt_ms, ...], errors, note).
    PING/PONG round-trip is the headline real-time metric: network RTT plus
    backend turnaround on a warm socket, i.e. how fast updates reach your bot.
    """
    try:
        import websocket  # websocket-client
    except ImportError:
        return None, None, [], 0, "websocket-client not installed -> WS skipped"

    connect_ms = None
    first_msg_ms = None
    rtts = []
    errors = 0
    note = ""

    try:
        t0 = time.perf_counter()
        ws = websocket.create_connection(
            url, timeout=timeout,
            sslopt={"cert_reqs": ssl.CERT_REQUIRED},
            header=[f"User-Agent: {USER_AGENT}"])
        connect_ms = (time.perf_counter() - t0) * 1000.0
    except Exception as e:
        return None, None, [], 1, f"WS connect failed: {e!r}"

    try:
        sub = {"type": "market"}
        if token_id:
            sub["assets_ids"] = [token_id]
        ws.send(json.dumps(sub))

        ws.settimeout(timeout)
        t_sub = time.perf_counter()
        try:
            _ = ws.recv()
            first_msg_ms = (time.perf_counter() - t_sub) * 1000.0
        except Exception:
            note = "no first message after subscribe (market may be quiet); "

        for _ in range(ping_count):
            try:
                t_ping = time.perf_counter()
                ws.send("PING")
                got_pong = False
                deadline = t_ping + timeout
                while time.perf_counter() < deadline:
                    msg = ws.recv()
                    if isinstance(msg, bytes):
                        msg = msg.decode(errors="ignore")
                    if msg and msg.strip().upper() == "PONG":
                        rtts.append((time.perf_counter() - t_ping) * 1000.0)
                        got_pong = True
                        break
                if not got_pong:
                    errors += 1
            except Exception:
                errors += 1
            time.sleep(ping_interval)
    finally:
        try:
            ws.close()
        except Exception:
            pass

    return connect_ms, first_msg_ms, rtts, errors, note


# ----------------------------------------------------------------------------
# VPS info (public IP + geolocation)
# ----------------------------------------------------------------------------

def get_vps_info(timeout):
    info = {"public_ip": None, "city": None, "region": None, "country": None, "org": None}
    try:
        req = urllib.request.Request("https://ipinfo.io/json", headers={"User-Agent": USER_AGENT})
        with urllib.request.urlopen(req, timeout=timeout) as r:
            data = json.loads(r.read().decode())
        info.update({k: data.get(k) for k in ("ip", "city", "region", "country", "org")})
        info["public_ip"] = data.get("ip")
    except Exception:
        pass
    return info


# ----------------------------------------------------------------------------
# Pretty printing
# ----------------------------------------------------------------------------

def print_table(title, rows, columns):
    print(f"\n{title}")
    print("-" * len(title))
    widths = {c: len(c) for c in columns}
    for row in rows:
        for c in columns:
            widths[c] = max(widths[c], len(str(row.get(c, ""))))
    print("  ".join(c.ljust(widths[c]) for c in columns))
    print("  ".join("-" * widths[c] for c in columns))
    for row in rows:
        print("  ".join(str(row.get(c, "")).ljust(widths[c]) for c in columns))


# ----------------------------------------------------------------------------
# Main
# ----------------------------------------------------------------------------

def main():
    ap = argparse.ArgumentParser(description="Polymarket VPS latency probe")
    ap.add_argument("--duration", type=int, default=600, help="total run time in seconds (default 600)")
    ap.add_argument("--interval", type=float, default=5.0, help="seconds between REST sampling rounds (default 5)")
    ap.add_argument("--ws-interval", type=float, default=5.0, help="seconds between WS PINGs, keep under 10 (default 5)")
    ap.add_argument("--timeout", type=float, default=5.0, help="per-operation timeout in seconds (default 5)")
    ap.add_argument("--quick", action="store_true", help="short ~20s sanity run")
    ap.add_argument("--no-ws", action="store_true", help="skip the WebSocket test")
    ap.add_argument("--no-geo", action="store_true", help="skip the public-IP / geo lookup")
    ap.add_argument("--csv", metavar="FILE", help="write every raw sample to this CSV")
    ap.add_argument("--json-out", metavar="FILE", help="write the summary JSON to this file")
    args = ap.parse_args()

    if args.quick:
        args.duration = 20
        args.interval = 2.0
        args.ws_interval = 2.0

    started = datetime.now(timezone.utc)
    print("=" * 60)
    print("  Polymarket VPS Latency Probe")
    print("=" * 60)
    print(f"host={socket.gethostname()}  start={started.isoformat()}")
    print(f"duration={args.duration}s  interval={args.interval}s  ws_interval={args.ws_interval}s  timeout={args.timeout}s")

    vps = {"public_ip": None, "city": None, "region": None, "country": None, "org": None}
    if not args.no_geo:
        vps = get_vps_info(min(args.timeout, 5.0))
        loc = ", ".join(x for x in (vps.get("city"), vps.get("region"), vps.get("country")) if x) or "unknown"
        print(f"location={loc}  org={vps.get('org') or 'unknown'}")

    # Resolve a live token id so the CLOB /book request reaches the origin.
    token_id = fetch_live_token_id(args.timeout)
    print(f"live token id for /book + WS subscribe: {token_id or 'NOT FOUND (/book will return an error status; timings still measured)'}")
    if INFURA_KEY:
        print("polygon RPC: using Infura (INFURA_KEY set)")

    endpoints = [dict(e) for e in REST_ENDPOINTS]
    for e in endpoints:
        if e["name"] == "clob_book" and token_id:
            e["url"] = f"https://clob.polymarket.com/book?token_id={token_id}"

    csv_f = None
    if args.csv:
        csv_f = open(args.csv, "w")
        csv_f.write("ts,endpoint,kind,metric,value_ms,status\n")

    def csv_log(name, kind, metric, value, status=""):
        if csv_f and value is not None:
            csv_f.write(f"{time.time():.3f},{name},{kind},{metric},{value:.3f},{status}\n")

    cold = {e["name"]: {k: [] for k in ("resolve_ms", "tcp_ms", "tls_ms", "ttfb_ms", "total_ms")} for e in endpoints}
    cold_err = {e["name"]: 0 for e in endpoints}
    warm = {e["name"]: [] for e in endpoints}
    warm_err = {e["name"]: 0 for e in endpoints}
    ips = {}
    statuses = {}

    warm_clients = {e["name"]: WarmClient(e["url"], args.timeout, e["method"], e["body"]) for e in endpoints}

    end_time = time.time() + args.duration
    rounds = 0
    print("\nSampling REST endpoints (Polymarket + chain + reference)...")
    while time.time() < end_time:
        rounds += 1
        for e in endpoints:
            name = e["name"]
            try:
                r = probe_rest_cold(e["url"], args.timeout, e["method"], e["body"])
                for k in ("resolve_ms", "tcp_ms", "tls_ms", "ttfb_ms", "total_ms"):
                    cold[name][k].append(r[k])
                    csv_log(name, "cold", k, r[k], r["status"])
                ips[name] = r["ip"]
                statuses[name] = r["status"]
            except Exception:
                cold_err[name] += 1
            try:
                w = warm_clients[name].request_ms()
                warm[name].append(w)
                csv_log(name, "warm", "rtt_ms", w)
            except Exception:
                warm_err[name] += 1
        if rounds % 10 == 0:
            print(f"  ...{rounds} rounds, {int(end_time - time.time())}s left")
        time.sleep(args.interval)

    for c in warm_clients.values():
        c.close()

    ws_result = None
    if not args.no_ws:
        print("\nProbing WebSocket market channel (PING/PONG round-trip)...")
        ping_count = max(1, int(args.duration / args.ws_interval))
        ping_count = min(ping_count, 120)
        connect_ms, first_msg_ms, rtts, ws_err, note = run_ws_probe(
            WS_MARKET_URL, token_id, ping_count, args.ws_interval, args.timeout)
        for v in rtts:
            csv_log("ws_market", "ws", "ping_rtt_ms", v)
        if connect_ms is not None:
            csv_log("ws_market", "ws", "connect_ms", connect_ms)
        if first_msg_ms is not None:
            csv_log("ws_market", "ws", "first_msg_ms", first_msg_ms)
        ws_result = {
            "url": WS_MARKET_URL,
            "connect_ms": round(connect_ms, 3) if connect_ms is not None else None,
            "first_msg_ms": round(first_msg_ms, 3) if first_msg_ms is not None else None,
            "ping_pong_rtt": summarize(rtts, ws_err),
            "note": note.strip(),
        }
        if note:
            print(f"  note: {note.strip()}")

    if csv_f:
        csv_f.close()

    summary = {
        "meta": {
            "host": socket.gethostname(),
            "started_utc": started.isoformat(),
            "finished_utc": datetime.now(timezone.utc).isoformat(),
            "duration_s": args.duration,
            "rest_rounds": rounds,
            "token_id": token_id,
            "vps": vps,
            "polygon_provider": "infura" if INFURA_KEY else "public",
        },
        "rest": {},
        "websocket": ws_result,
    }
    for e in endpoints:
        name = e["name"]
        summary["rest"][name] = {
            "url": e["url"],
            "method": e["method"],
            "group": e["group"],
            "resolved_ip": ips.get(name),
            "http_status": statuses.get(name),
            "trade_critical": e["critical"],
            "cold": {k: summarize(cold[name][k], cold_err[name]) for k in
                     ("resolve_ms", "tcp_ms", "tls_ms", "ttfb_ms", "total_ms")},
            "warm_rtt": summarize(warm[name], warm_err[name]),
        }

    print("\n" + "=" * 70)
    print("SUMMARY  (lower is better; watch p99 and stdev for consistency)")
    print("=" * 70)

    rest_rows = []
    for e in endpoints:
        name = e["name"]
        s = summary["rest"][name]
        warm_s = s["warm_rtt"]
        tcp_s = s["cold"]["tcp_ms"]
        ttfb_s = s["cold"]["ttfb_ms"]
        rest_rows.append({
            "endpoint": ("* " if e["critical"] else "  ") + name,
            "grp": e["group"],
            "ip": s["resolved_ip"] or "-",
            "st": s["http_status"] if s["http_status"] is not None else "-",
            "tcp_p50": tcp_s["p50_ms"],
            "ttfb_p50": ttfb_s["p50_ms"], "ttfb_p99": ttfb_s["p99_ms"],
            "warm_p50": warm_s["p50_ms"], "warm_p99": warm_s["p99_ms"],
            "warm_jit": warm_s["stdev_ms"],
            "err": warm_s["errors"] + tcp_s["errors"],
        })
    print_table(
        "REST  (* = trade-critical)  [all ms; grp pm=Polymarket chn=chain ref=reference]",
        rest_rows,
        ["endpoint", "grp", "ip", "st", "tcp_p50", "ttfb_p50", "ttfb_p99",
         "warm_p50", "warm_p99", "warm_jit", "err"],
    )
    print("  tcp_p50  = network RTT proxy (raw distance/route to the edge)")
    print("  warm_*   = per-request round-trip on a pooled connection (what a live bot sees)")
    print("  warm_jit = stdev (jitter); high jitter = unpredictable fills")

    if ws_result and ws_result["ping_pong_rtt"]["ok"]:
        pp = ws_result["ping_pong_rtt"]
        print("\nWEBSOCKET market channel  [ms]  <- THE real-time metric")
        print("-" * 50)
        print(f"  connect handshake : {ws_result['connect_ms']}")
        print(f"  first message     : {ws_result['first_msg_ms']}")
        print(f"  PING/PONG p50     : {pp['p50_ms']}")
        print(f"  PING/PONG p95     : {pp['p95_ms']}")
        print(f"  PING/PONG p99     : {pp['p99_ms']}")
        print(f"  PING/PONG max     : {pp['max_ms']}")
        print(f"  PING/PONG jitter  : {pp['stdev_ms']}  (stdev)")
        print(f"  samples / errors  : {pp['ok']} / {pp['errors']}")
    elif ws_result:
        print(f"\nWEBSOCKET: no successful PING/PONG. note: {ws_result['note']}")

    def g(name, section, metric, sub="warm_rtt"):
        s = summary["rest"].get(name)
        if not s:
            return None
        if sub == "warm_rtt":
            return s["warm_rtt"].get(metric)
        return s["cold"][section].get(metric)

    print("\n" + "=" * 70)
    print("DECISION METRICS  (compare these across hosts)")
    print("=" * 70)
    book_p50 = g("clob_book", None, "p50_ms")
    book_p99 = g("clob_book", None, "p99_ms")
    relayer_ttfb = g("relayer_nonce", "ttfb_ms", "p50_ms", sub="cold")
    polygon_ttfb = g(POLYGON_NAME, "ttfb_ms", "p50_ms", sub="cold")
    ws_p50 = ws_result["ping_pong_rtt"]["p50_ms"] if (ws_result and ws_result["ping_pong_rtt"]["ok"]) else None
    ws_p99 = ws_result["ping_pong_rtt"]["p99_ms"] if (ws_result and ws_result["ping_pong_rtt"]["ok"]) else None
    print(f"  Order path  (CLOB /book warm)  p50={book_p50} ms   p99={book_p99} ms   <- post/cancel")
    print(f"  Live feed   (WS PING/PONG)     p50={ws_p50} ms   p99={ws_p99} ms   <- sees the book")
    print(f"  Relayer     (gasless on-chain ops)   ttfb_p50={relayer_ttfb} ms")
    print(f"  Polygon RPC (settlement)       ttfb_p50={polygon_ttfb} ms")

    print("\nHow to choose a VPS:")
    print("  1. Compare 'Order path' warm p50 and the WS PING/PONG p50 across hosts (primary).")
    print("  2. Prefer the host with the lower p99 / jitter even if p50 ties (tails cost fills).")
    print("  3. tcp_p50 to clob shows raw network distance; a transit detour shows up here.")
    print("  4. Run the whole thing twice before you conclude anything.")

    out = json.dumps(summary, indent=2)
    if args.json_out:
        with open(args.json_out, "w") as f:
            f.write(out)
        print(f"\nFull JSON summary written to {args.json_out}")
    else:
        print("\nFull JSON summary:")
        print(out)
    if args.csv:
        print(f"Raw per-sample CSV written to {args.csv}")


if __name__ == "__main__":
    try:
        main()
    except KeyboardInterrupt:
        print("\nInterrupted.", file=sys.stderr)
        sys.exit(130)
How to run it
SSH into the VPS you want to test. Always run this from the VPS itself, never from your home machine, because a home connection adds latency that has nothing to do with the server.
The script needs one package for the WebSocket test. Newer Ubuntu and Debian releases block system-wide pip installs, so the clean way is a virtual environment:
sudo apt install python3-pip
sudo apt install python3-venv
python3 -m venv ~/venv/pm-latency
source ~/venv/pm-latency/bin/activate
pip install websocket-client
python3 latency.py
That is the whole setup. If you come back in a later SSH session, activate the environment again before running:
source ~/venv/pm-latency/bin/activate
One expectation to set before you start: at the default settings, a full run takes about twenty minutes, ten of REST sampling followed by up to ten of WebSocket pings. The two phases run in sequence, not in parallel, so do not kill it when the REST table looks done.
On Windows Server, pip install websocket-client works as-is from PowerShell, since the standard Python installer is not externally managed.
If you would rather install nothing at all, run with --no-ws. You lose the WebSocket feed measurement, but every REST test still runs.
Useful flags:
--quickfor a roughly 20-second sanity run while you are setting up--duration 600keeps the REST sampling at the full ten minutes that gives trustworthy tail statistics (the WebSocket phase then follows)--csv run.csv --json-out run.jsonto save raw samples and the summary for later comparison--no-wsto skip the WebSocket testINFURA_KEY=xxxx python3 latency.pyto use a paid Polygon endpoint instead of the public one
A full run for real numbers looks like this:
python3 latency.py --duration 600 --csv run1.csv --json-out run1.json
For a fair comparison, run the same command on each box at the same time, within a few minutes of each other, so market activity is held constant.
How to read the output
The script prints a per-endpoint table, a WebSocket section, and a Decision Metrics block with the handful of numbers that actually drive a verdict:
- Order path (CLOB /book warm) p50 and p99, how fast you post and cancel orders
- Live feed (WebSocket PING/PONG) p50 and p99, how fast your bot sees the book move
- Relayer TTFB, the gasless on-chain operations path (approvals, redemptions)
- Polygon RPC TTFB, the settlement chain
Compare across boxes on the order-path and feed numbers, weight the tail and the jitter, and remember that a lower number only means something if both runs happened at the same hour.
One reading caveat on the WebSocket numbers: while the probe waits for a PONG it also reads through any market messages queued ahead of it, so on a very busy token a PING round-trip can include a moment of backlog drain. That is realistic, your bot has to chew through the same backlog, but it means a feed spike during a hot market is not automatically a network problem.
Real Polymarket VPS latency results: two locations, two runs
Here is a worked example of the method above, run against live Polymarket infrastructure from two of our own boxes, one in Dublin and one in Amsterdam. Both were probed concurrently, in the same window, 600 seconds of REST sampling per run plus the WebSocket phase, against the same live token. Then we ran the whole thing again.
That second run turned out to be the most useful decision in the exercise.
Run 1, June 2026, both boxes probed simultaneously
| Path | Dublin | Amsterdam |
|---|---|---|
| Order path, warm p50 | 22.03 ms | 26.37 ms |
| Order path, p99 | 49.33 ms | 45.32 ms |
| Live feed, p50 | 16.20 ms | 10.09 ms |
| Live feed, p99 | 36.61 ms | 49.68 ms |
| Live feed, jitter | 11.04 ms | 6.44 ms |
| TCP connect | 1.47 ms | 0.85 ms |
| TLS handshake | 16.12 ms | 17.20 ms |
| Polygon RPC, warm | 24 ms | 7 ms |
Run 2, same boxes, same script
| Path | Dublin | Amsterdam |
|---|---|---|
| Order path, warm p50 | 26.53 ms | ~22 ms |
Read those two tables together and four things fall out. Only one of them is about which city is faster.
Finding 1: the order-path winner changed between runs
In run 1, Dublin led the order path by about four milliseconds. In run 2, Amsterdam led it by about the same margin. Same boxes, same script, same method, a short time apart.
We could have published either run on its own and told a clean story. “Dublin is 4 ms faster to the order book” would have been a perfectly good marketing line supported by real data that we really collected. It would also have been wrong, and we would only have known that because we ran it again.
This is the single most important lesson in this guide. Between two well-connected boxes, the order-path median sits inside run-to-run variance, because most of that round trip is Polymarket’s own matching engine, which is identical for every customer of every provider. Be suspicious of any provider comparison built on a single run, including one of ours.
Finding 2: the feed gap held, and the median disagreed with the tail
Amsterdam saw the book roughly six milliseconds sooner on the median, and that held across both runs, so it is a real difference rather than noise.
But look at the tail. Dublin’s feed p99 was 36.61 ms against Amsterdam’s 49.68 ms, tighter by about thirteen milliseconds. And Amsterdam’s jitter was lower, at 6.44 against 11.04.
That combination looks contradictory until you remember what each number measures. Amsterdam was more consistent across the bulk of its samples, which is what jitter captures, while Dublin’s rare worst cases were less bad, which is what p99 captures. Both are true at once, and which one you care about depends on your strategy: a feed-reactive bot lives on the median, while a market maker sizing risk lives on the worst case it has to survive.
If you take one habit from this section, it is reading median, tail and jitter together. Any one of them alone would have told you a different story here.
Finding 3: raw distance was not the differentiator
TCP connect came in at 1.47 ms and 0.85 ms. Both are essentially at the floor, meaning both boxes sit one short hop from the Polymarket edge they reach. TLS was 16.12 against 17.20, effectively tied, and paid once per connection anyway.
So the differences that showed up further along did not come from geography. This is worth internalising before you shop for a location: the city gets you into the right neighbourhood and almost nothing more. Two boxes in the same city can route differently, and two boxes in different cities can be indistinguishable on distance.
Finding 4: the biggest gap was on the path nobody tests
The Polygon RPC answered in about 7 ms from Amsterdam and about 24 ms from Dublin. Seventeen milliseconds, which is larger than any single Polymarket-path gap in the tables above.
Polymarket matches orders off-chain, so this is not on your order hot path and we are not going to inflate it into one. But if your bot checks allowances or reads chain state inside a loop that matters, that gap is real, and it goes entirely unmeasured by every latency comparison we have seen.
The general lesson: probe every endpoint your strategy actually touches. If you price Polymarket off a reference venue, measure that path too. When we did, our Dublin box reached a far edge of a major exchange’s API at around 313 ms while other boxes in the same city reached a near edge at around 208 ms. Same city, different routing, on a path that matters to a whole strategy class. We published that against ourselves and it is on the routing roadmap.
What this worked example is, and what it is not
These are two boxes on two days, not a verdict on either city. If you want the location question answered properly, with the full side-by-side, that lives in our Dublin versus Amsterdam comparison. What this section is for is showing you what the output of the method looks like, including the parts that did not resolve neatly.
Troubleshooting your Polymarket latency test results
A steady TCP connect of 10 ms or more, when you expect sub-millisecond, usually means a routing detour: your traffic is travelling to a distant edge or through an extra transit carrier. Run mtr from Method 1 to confirm the path. That is the provider’s network to fix; no operating system setting changes a route.
Good warm numbers with bad cold numbers is fine for a real bot, as long as your bot actually uses a persistent connection pool and a long-lived WebSocket so it lives on the warm path. A bot that opens a fresh connection per request pays the handshake on every order for no reason.
Wildly inconsistent tails across runs point at contention rather than the network. Check CPU steal time with top (the %st column) during a busy hour. On a healthy box that sits near zero.
A large gap between your medians and Polymarket’s own response times is expected and is not something a provider fixes. The venue’s processing time is part of every measurement and is shared by everyone.
How to compare Polymarket VPS providers fairly
Pulling the method together:
- Test from each VPS itself, never from home internet.
- Run the full probe, about twenty minutes end to end, not a quick ping.
- Run each box at the same time of day, within minutes of each other, so market activity is held constant.
- Run it more than once. See Finding 1. This is the step almost nobody does, and it is the one that catches false conclusions.
- Compare on order-path p50 and p99, feed p50 and p99, and jitter together, not in isolation.
- Confirm routing with
mtr, so you know each box reaches its edge without a detour. - Probe every venue your strategy reads, not only Polymarket.
- Validate with a real fill-and-kill order before committing size.
What not to compare: an advertised ping figure, core count (a bot’s hot loop is single-threaded), or an uptime number in isolation.
Why “1 ms to Polymarket” marketing is theater
Almost every trading VPS sales page leads with a sub-millisecond number. Here is what that number actually is.
When you ping a nearby server, the round trip might genuinely be about a millisecond. But that is an ICMP echo on an already-open path, with no connection setup, no encryption negotiation, and no request processing. A real first API call is tens of milliseconds once you add those. A warm pooled request settles around twenty. Your live feed round-trip is in the teens. The advertised figure is technically true and practically irrelevant, because it conflates a ping with an order.
We benchmarked that claim out of existence on our own boxes, which is why every number in this guide is in the tens of milliseconds and none of them are ours to promise. Serious traders do not care about ping. They care about the warm order-path round-trip and the feed latency, measured over hundreds of samples with the tail and the jitter reported.
Pre-launch Polymarket VPS latency checklist
Before you run real capital through a Polymarket bot on any VPS:
- Run the probe from the VPS itself, the full run, about twenty minutes
- Run it a second time, at the same hour, and compare the two
- Confirm the order-path p99 is not a large multiple of the median
- Confirm the feed median and jitter are both controlled
- Run
mtrand confirm a short path with no distant detour - Probe every venue your strategy reads, not only Polymarket
- Switch the Polygon RPC to a paid endpoint if you make chain calls
- Check CPU steal time during a busy hour
- Make sure your bot uses connection pooling and a persistent WebSocket
- Validate end to end with a fill-and-kill order before going live
Test it on ours
Everything above is reproducible, and we would rather you checked than believed us. Our free 3-day demo exists so the first job your bot does on our hardware is fact-checking this page. Run the script, read your own tails, and if our box loses your probe, buy the winner and tell us, because that is a routing ticket we want to see.
If you are still deciding where to host rather than how to measure, the location guide covers that question, and the bot setup guide covers the build.
What changed in the July 2026 update
- The measurement script is a full rewrite: warm pooled round-trips, a real WebSocket PING/PONG test, and the complete endpoint stack (CLOB, feed, relayer, Gamma and Data APIs, Polygon RPC, reference venue) in one run, with p50 through p99 and jitter.
- The results are new: two locations probed concurrently against the same live token, and the whole set run twice, with the run-to-run swap published rather than smoothed over.
- The jurisdiction note reflects Polymarket’s July 2026 tier changes for Ireland and the Netherlands, including why the geoblock endpoint reads blocked from both while the API is unaffected.
Frequently Asked Questions
Run a sustained Python benchmark from the VPS itself that measures the warm round-trip on the order path and a WebSocket PING/PONG on the live feed, over several hundred samples, reporting p50, p99 and jitter. A one-off ping or a cold command-line check does not reflect what a real bot experiences. Then run it again at the same hour and compare, because a single run can mislead you. The complete script and the install commands are in this guide.
From a well-placed European box, expect a warm order-path median in the low twenties of milliseconds and a feed median in the low-to-mid teens, both with a tail that is not a large multiple of the median. The physical floor is set by distance plus Polymarket’s own server time, so well-located providers cluster near the same numbers. The differentiator is consistency, not raw median.
p50 is the median, your typical latency. p99 is the level at which ninety-nine percent of requests complete, which is the tail that costs you fills during a fast market. Jitter is the standard deviation, describing how spread out the bulk of your samples are. They can disagree: in our own results one box had lower jitter but a worse p99 than the other, meaning it was steadier most of the time and worse in its rare worst moments. Read all three.
Because a few milliseconds of difference between two well-connected boxes is inside normal run-to-run variance. Most of the order round-trip is Polymarket’s own matching engine rather than the network leg, so small differences move around between runs. That is exactly why we ran it twice, and why we would treat any single-run provider comparison with suspicion.
A ping measures an ICMP echo on an already-open path. A real API request also pays connection setup on the first call, plus Polymarket’s server processing time. Your warm trading latency is in the tens of milliseconds even when a ping reads about a millisecond, which is why ping is not a useful trading metric.
Always from the VPS, because that is where your bot runs. A home connection adds ISP and routing overhead that has nothing to do with the server, so testing from home tells you about your home connection instead.
At minimum the CLOB order book and the WebSocket market channel. A complete test also covers the relayer, the Gamma and Data APIs, the Polygon RPC, and any reference venue your strategy prices against. In our own results the settlement path showed the largest gap of anything we measured, and it is the one almost nobody tests.
Establish a baseline when you set the box up, then re-test monthly or before any significant change, and immediately if you notice execution degrading. Always re-run at the same time of day as your baseline so the comparison holds.
Latency figures are our own measurements from our Dublin and Amsterdam boxes against live Polymarket endpoints in June 2026, using the script published above, with both locations probed concurrently and the full set repeated. Network performance varies with routing, market activity and configuration, so measure your own box before committing capital. We operate TradoxVPS and provide infrastructure, not financial or trading advice.