Benchmarked June 4, 2026 — one synchronized evening window, four providers, every raw file downloadable below. Next scheduled re-run: within the quarter, published with dates.
Disclosure, before anything else: we operate TradoxVPS, one of the four providers tested. That is exactly why this article contains no adjectives where a number will do — and why it’s built so you never have to take our word for anything.
How to verify everything in this article
A vendor benchmark earns exactly as much trust as it can survive being checked. So here is the evidence chain, and the rules we ran under:
- Four raw probe outputs — one per provider — downloadable, unedited, timestamps intact.
- One run per host. No re-rolls. Nobody — including us — got a second attempt. The tables below are every run we made.
- Synchronized starts, printed: TradoxVPS, QuantVPS and NYCServers began within 8 seconds of each other (20:33 UTC). The AWS run began one hour earlier (19:33 UTC) — disclosed in the setup table and considered in the limitations, not hidden.
- The probe prints each box’s upstream network (ASN) — ours included — and
lscpuoutput for the tested boxes ships with the raw data. - Falsifiability: the probe is public, takes twenty minutes, and runs on anything with Python. If your numbers disagree, send them — corrections get published here with a date on them.
- What we concede up front: our box printed the worst live-feed tail of the window, and the latency composite went to a $25 competitor box. Keep reading anyway; that’s rather the point.
TL;DR
- All four boxes are in Dublin — TradoxVPS, AWS eu-west-1, QuantVPS, and (to our surprise) the NYCServers DUB1 unit — a same-city test where medians are physics and differences are engineering.
- NYCServers won the latency composite — not us. Fastest feed median, tightest feed tail, fastest order median. We’re printing it, with the derivation shown.
- We won the order-path tail outright: p99 of 37.0 ms and a worst sample of 40.9 ms — the only box that never exceeded 41 ms on the order path all run. And our feed p99 (68.2 ms) was the worst of the field. Both are printed.
- The most remarkable number is a ceiling: NYCServers moved large payloads at 161.4 ms with a standard deviation of 1.7 ms across 88 samples — ~8× slower than the leaders, and flat as a policy. That’s a shaped pipe, not congestion.
- QuantVPS ran mid-pack on every decision metric, with its ~2× payload penalty and split DNS resolver on display.
- At the serious-bot tier, the price order inverts: $44.90 (us) / $48 / $79.99 / ~$94 — and only one of those four boxes runs 5.7 GHz silicon on DDR5.
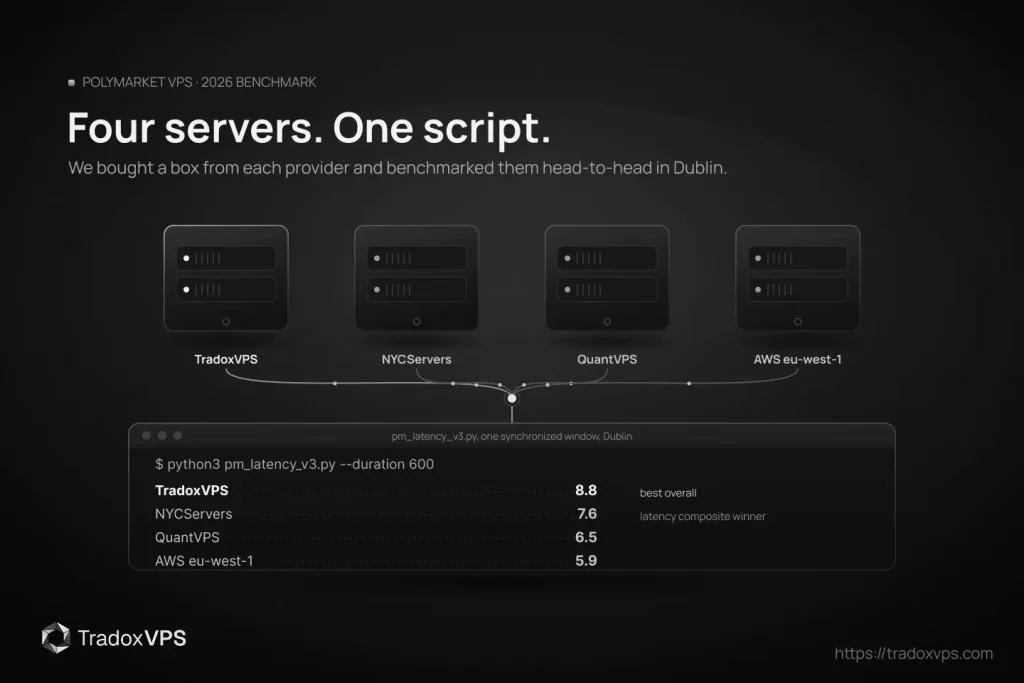
- Weighted scorecard: TradoxVPS 8.8, NYCServers 7.6, QuantVPS 6.5, AWS 5.9 — weights, rubric, and every losing row published so you can re-weight and disagree.
Polymarket VPS benchmark methodology: what we measured and why
The probe is the open one documented step-by-step in How to test the latency of your Polymarket VPS. Per host: ~600 seconds, ~88–98 REST rounds at a 5-second cadence (slow enough to never trip rate limits), plus 120 WebSocket PING/PONG samples. Each REST round measures two different things on purpose:
- The cold path — a fresh connection, phase-timed: DNS lookup → TCP handshake → TLS handshake → time-to-first-byte. This is what a bot pays on reconnect, and it fingerprints the box: DNS exposes the resolver setup, TCP exposes raw route distance, TLS exposes the CPU (it’s an asymmetric-crypto burst).
- The warm path — a request on an already-pooled connection. This is what a live bot pays on every order and every poll, and it’s the number that decides fills.
The two decision metrics: warm round-trips to /book with a live token_id (the closest no-auth proxy for post/cancel feel) and WebSocket PING/PONG on the market channel (who sees the book move first). Why /book and not the API root: the / endpoint showed an ugly 250–650 ms p99 tail on all four runs — an identical server-side artifact that would smear every comparison. When all four boxes show the same disease, the disease isn’t theirs; we measure where the signal is.
One honesty note about percentiles: with ~90–120 samples, a p99 is essentially “the worst one or two samples of the run.” That’s exactly what a trading bot cares about — and it’s why single-run tails should be read alongside p95 and the worst sample, which we print, and why this page re-benchmarks on a schedule rather than asking you to trust one evening forever.
Test setup: four providers, one head-to-head window
| TradoxVPS | AWS eu-west-1 | QuantVPS | NYCServers | |
|---|---|---|---|---|
| Window (UTC, June 4) | 20:33–20:53 | 19:33–19:53¹ | 20:33–20:53 | 20:33–20:53 |
| Samples (REST/WS) | 92 / 120 | 98 / 120 | 95 / 120 | 88 / 120 |
| Errors | 0 | 0 | 0 | 0 |
¹ The three flat-rate boxes started within 8 seconds of each other. The AWS run executed one hour earlier; we print it as recorded rather than relabeling anything, and the limitation is repeated where it matters. Same script, same token, same evening.
Result 1 — Live feed latency (WebSocket PING/PONG)
Who sees the book first. 120 samples per host:
| ms | TradoxVPS | AWS | QuantVPS | NYCServers |
|---|---|---|---|---|
| p50 | 13.7 | 15.3 | 14.6 | 13.6 |
| p95 | 28.7 | 23.2 | 35.2 | 18.0 |
| p99 | 68.2 | 44.8 | 42.8 | 36.4 |
| worst sample | 127.6 | 60.1 | 91.4 | 241.1 |
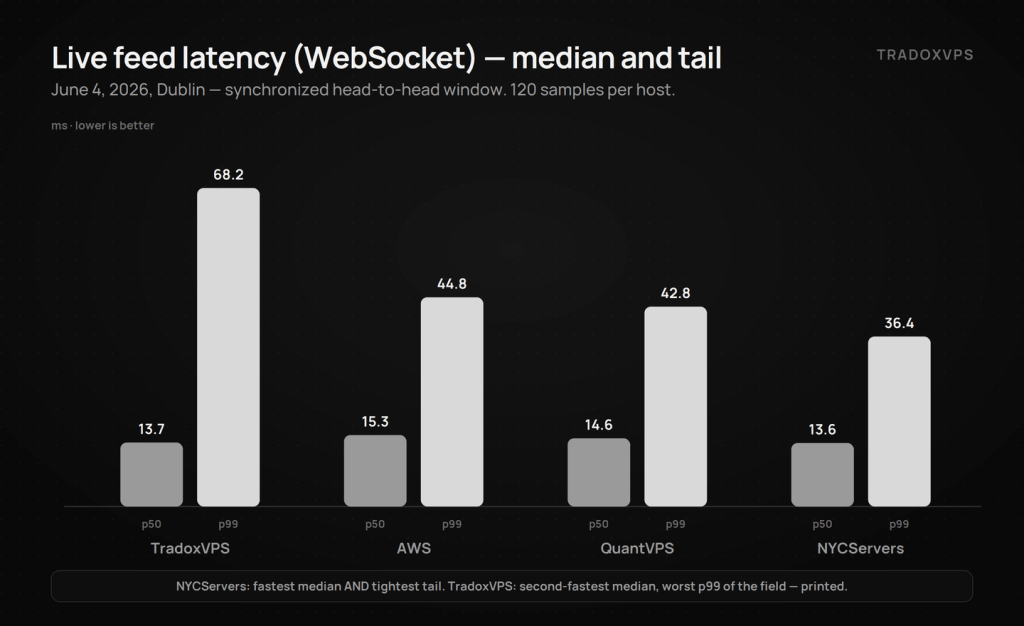
One 241 ms spike in NYC’s 120 samples — its p95 of 18.0 ms is the best of the field by a wide margin, and that single outlier is why we print worst samples instead of letting any one statistic flatter anyone.
NYCServers takes this table: fastest median, and a p95/p99 pair nobody else approached. Our box posted a fine median (13.7, second) and the worst p99 of the field — 68.2 ms. Said plainly, with no scapegoat sample to blame: on this window’s feed tail, we were last. It’s on our engineering board, and the fix gets verified the only legitimate way — a fresh synchronized re-run of all four providers, published with dates.
Result 2 — Order path latency (warm round-trips to the live order book)
The closest no-auth proxy for post/cancel feel:
| ms | TradoxVPS | AWS | QuantVPS | NYCServers |
|---|---|---|---|---|
| p50 | 22.5 | 23.1 | 22.6 | 21.2 |
| p95 | 28.3 | 41.6 | 33.5 | 32.9 |
| p99 | 37.0 | 55.3 | 53.1 | 43.3 |
| worst sample | 40.9 | 61.9 | 86.0 | 61.2 |
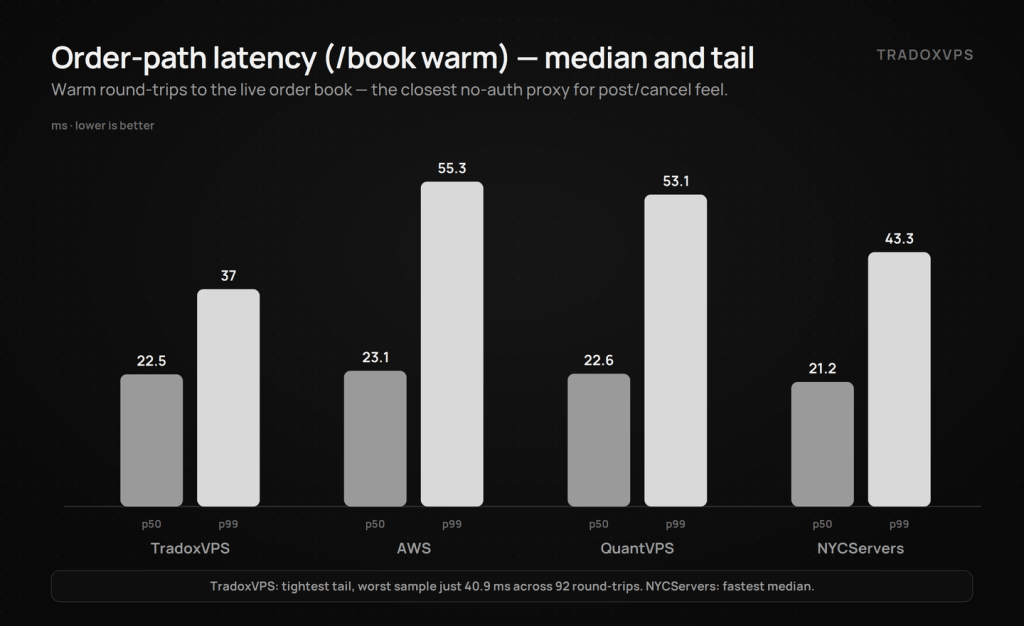
This table is ours: the tightest p95, the tightest p99, and the only worst-sample under 41 ms — meaning across ninety-two warm round-trips to the live book, our box never once exceeded 40.9 ms. NYCServers took the median (21.2) with a respectable tail; QuantVPS and AWS both let go past 53 ms at p99. Order-path tail is the number that prices worst-case fill risk, and this window it belonged to the 9950X.
Result 3 — What one window can and can’t tell you
We’re a vendor publishing our own benchmark, so let’s be precise about epistemics. One window can establish: who was faster head-to-head in the same minutes (the three synchronized boxes), within-run consistency (88–120 samples per metric), and structural fingerprints that don’t depend on market conditions — resolver configuration, TLS speed, payload ceilings. One window cannot establish: whether a tail result is a trait or an evening — our 68.2 feed p99 and our 37.0 order p99 both carry that caveat equally. That cuts both ways and we accept both cuts. The findings below are the within-run, structural kind; the re-run commitment at the bottom is how the rest gets settled.
Three within-run findings worth your attention:
- The CLOB
/root endpoint produced a 250–650 ms p99 tail on all four boxes — Polymarket’s server side, identical everywhere, which is exactly why decisions here use/book. - NYCServers’ large-payload transfers were abnormally consistent — see the next section.
- Our box’s reference probe to Binance’s API routed to a far edge (~313 ms warm) while the other three boxes hit a near edge (~208–212 ms). Irrelevant for Polymarket-only bots; material if your strategy references Binance prices from the same box, and on our routing team’s desk now.
Deep dive: the 161 ms ceiling — how to recognize traffic shaping in latency data
/markets returns a large payload; everything else in the probe moves small frames. The full split:
| TradoxVPS | AWS | QuantVPS | NYCServers | |
|---|---|---|---|---|
| /markets warm p50 (large payload) | 20.9 | 21.1 | 40.7 | 161.4 |
| /markets warm stdev | 1.8 | 1.3 | 8.9 | 1.7 |
| Cold DNS median | ~0.3 ms | ~0.5 ms | ~1.2 ms CLOB / ~12 ms others | ~12.7 ms |
| TLS handshake p50 | 15.3 | 10.6 | 8.0 | ~38 |
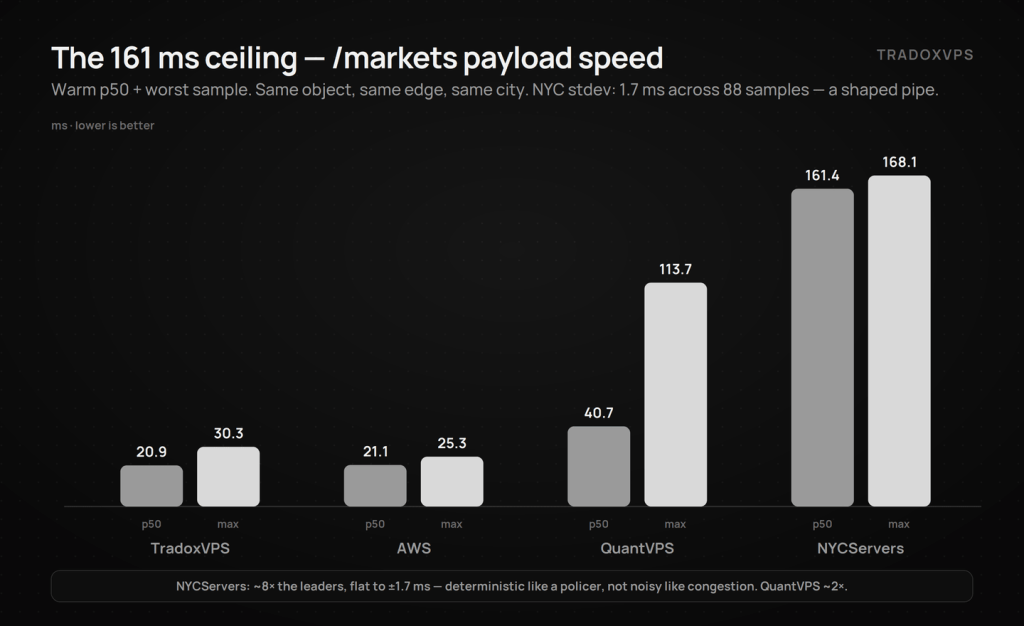
CLOB hostnames cached, relayer/Polygon lookups paying ~12 ms — a partially-warmed resolver.
Now the engineering read on that NYCServers row. The same object, from the same Cloudflare edge, in the same city, took ~8× longer to transfer than on the leaders — with a standard deviation of 1.7 ms across 88 samples spanning twenty minutes. Congestion is noisy by nature; a bandwidth policer is deterministic by design. A transfer time that flat on a fixed-size object is the signature of a shaped pipe, not a busy one. And note the precision of the box’s profile: its small-frame PING/PONG p95 was the best of the field in the same minutes its bulk transfers crawled — shaping caps throughput, not per-packet latency. Event-driven bots on warm sockets won’t feel it; anything pulling book snapshots, market scans, or history hits the ceiling on request one. QuantVPS shows a softer version of the same fingerprint (~2×, equally steady relative to its leaders).
Deep dive: DNS and TLS — the cold path as a silicon-and-image fingerprint
Two cold-path rows, two diagnoses you can run on any box you rent.
DNS. Our box resolved in ~0.3 ms; the NYCServers box paid ~12.7 ms on every cold lookup. That gap is not the network — both boxes sit in Dublin — it’s the image: one ships a local caching resolver, the other forwards every query to a resolver ~12 ms away. It only bites on reconnects and new hostnames, but reconnects are precisely the moments a bot can least afford to queue behind a lookup. The fix takes minutes on any provider (walkthrough in the methodology post); QuantVPS’s split profile (~1 ms on CLOB names, ~12 ms on relayer/Polygon) is what a partially-warmed cache looks like.
TLS. A TLS handshake is a burst of asymmetric crypto — it runs at the speed of one CPU core, which makes it a free silicon benchmark hiding in the timing data. This window’s ladder: 8.0 ms (QuantVPS) → 10.6 ms (the AWS m7a.large — exactly the cold-path speed 4th-gen EPYC should show) → 15.3 ms (us) → ~38 ms (NYCServers’ EPYC 7313P). Cold-path only — a warm bot doesn’t re-handshake — but it tells you what the core under you can do before you’ve run a single line of your own code. One general cloud note: AWS doesn’t sell a fixed spec — silicon varies by instance family and launch — so whatever you rent there, run this same probe on your instance before trusting anyone’s numbers, including ours.
Hardware for trading bots: single-thread speed is the spec that matters
A Polymarket bot’s hot loop — parse the book update, decide, sign the EIP-712 order, write it to the socket — is mostly single-threaded. JSON parsing, strategy logic, and signing all run on one core at a time; the loop runs at the speed of that core, not the sum of cores. Four cores at 3.7 GHz don’t make it faster than two cores at 5.7 GHz; they just run more copies of it.
| TradoxVPS | AWS | QuantVPS (Dublin) | NYCServers (Dublin) | |
|---|---|---|---|---|
| CPU (observed on our unit) | AMD Ryzen 9 9950X (Zen 5) | AMD EPYC — m7a.large, as launched | Intel Xeon (Cascade Lake) | AMD EPYC 7313P (Zen 3) |
| Single-core boost | up to 5.7 GHz | ~3.7 GHz (m7a) | per model | 3.7 GHz |
| Memory | DDR5 | DDR5 (Genoa platform) | DDR4 (Cascade Lake platform) | DDR4 |
The headline is simple: of the four boxes in this test, ours was the only one running current-generation desktop silicon — a 9950X at up to 5.7 GHz on DDR5. Everything else is server-class hardware in the ~3.7 GHz range: the EPYC 7313P is capable 2021 silicon on DDR4; the QuantVPS Dublin unit we purchased reported an Intel Xeon of the Cascade Lake generation — Intel’s 2019 server line, as exposed by the hypervisor; the AWS box was an m7a.large (as launched), running 4th-gen server EPYC in the same ~3.7 GHz clock class — modern silicon, server clocks. The ~38 ms TLS handshakes on the NYCServers box are this table made visible.
What the boxes themselves report (lscpu):
TradoxVPS  : Model name: AMD Ryzen 9 9950X 16-Core Processor   (CPU family 26 — Zen 5)
NYCServers : Model name: AMD EPYC 7313P 16-Core Processor      (CPU family 25 — Zen 3)
QuantVPS   : Model name: Intel Xeon Processor (Cascadelake)    (CPU family 6, model 85)
Full outputs ship with the raw data. Two transparency notes. QuantVPS’s public materials emphasize Ryzen hardware; the Dublin instance we purchased reported the Xeon above — we claim nothing about their wider fleet, only what our box showed. And run the same check on anything you buy, from anyone, including us:
lscpu | grep -E 'Model name|CPU family|CPU\(s\)'
On AWS, get the exact instance type from inside the box (IMDSv2):
TOKEN=$(curl -s -X PUT "http://169.254.169.254/latest/api/token" -H "X-aws-ec2-metadata-token-ttl-seconds: 60")
curl -s -H "X-aws-ec2-metadata-token: $TOKEN" http://169.254.169.254/latest/meta-data/instance-type
Even the vulnerability flags at the bottom of lscpu talk: a box reporting Intel-class items like Mmio stale data: Vulnerable alongside Retbleed: Vulnerable is telling you it’s older Intel server silicon, whatever the product page says.
Polymarket VPS pricing compared: the job, not the plan lists
Four pricing models that don’t line up — so two honest cuts instead of one fake table.
Cut 1 — the cheapest possible seat. NYCServers wins outright: from ~$16.67/month on annual billing ($25 monthly) for its 2-core/2 GB entry tier — which is the exact box we benchmarked (its lscpu shows 2 vCPUs). Every latency number in its column came from the cheapest thing they sell. That’s to its credit, and it’s why it takes the budget verdict below.
Cut 2 — the serious-bot tier, like for like. What each provider charges for the tier closest to an always-on production bot — comparable to our $44.90 Starter. Prices checked June 4, 2026; always confirm on the provider’s site.
| Comparable tier | Flat monthly | Single-core class | |
|---|---|---|---|
| TradoxVPS | 2 cores 9950X · 6 GB DDR5 | $44.90 | Ryzen 9950X — Zen 5 desktop, up to 5.7 GHz |
| NYCServers | 4 cores EPYC · 8 GB DDR4 | $48 | EPYC — Zen 3 server, 3.7 GHz |
| QuantVPS | 4 cores Intel Xeon · 8 GB | $79.99 | Xeon Cascade Lake — server (2019) |
| AWS | m7a.large (2 vCPU EPYC · 8 GB) — the tested instance | $0.1292/hr ≈ $94/mo on-demand, before EBS + egress | EPYC Genoa — server (Zen 4), ~3.7 GHz |
Read it with the single-thread lens: at this tier we’re both the cheapest box and the only one above 5 GHz. NYCServers asks $3 more for twice as many slower cores — a fine trade for parallel workloads, not for a single-threaded hot loop. QuantVPS charges $80 for four cores of 2019 Xeon. AWS lands around twice our price before the metered extras — and the line item that ambushes people is data transfer out: a 24/7 bot pays per gigabyte leaving the region on top of instance-hours and storage (committed savings plans cut the rate, at the price of flexibility). Build your own number in the AWS calculator; any single figure we printed would be wrong for your workload.
Fairness note: cores aren’t fungible and neither are bills — “comparable” means the nearest tier a serious bot would actually run on, not identical specs. For AWS the comparison is exact: the m7a.large priced above is the same instance type we benchmarked. Both cuts are shown and every number is screenshot-dated.
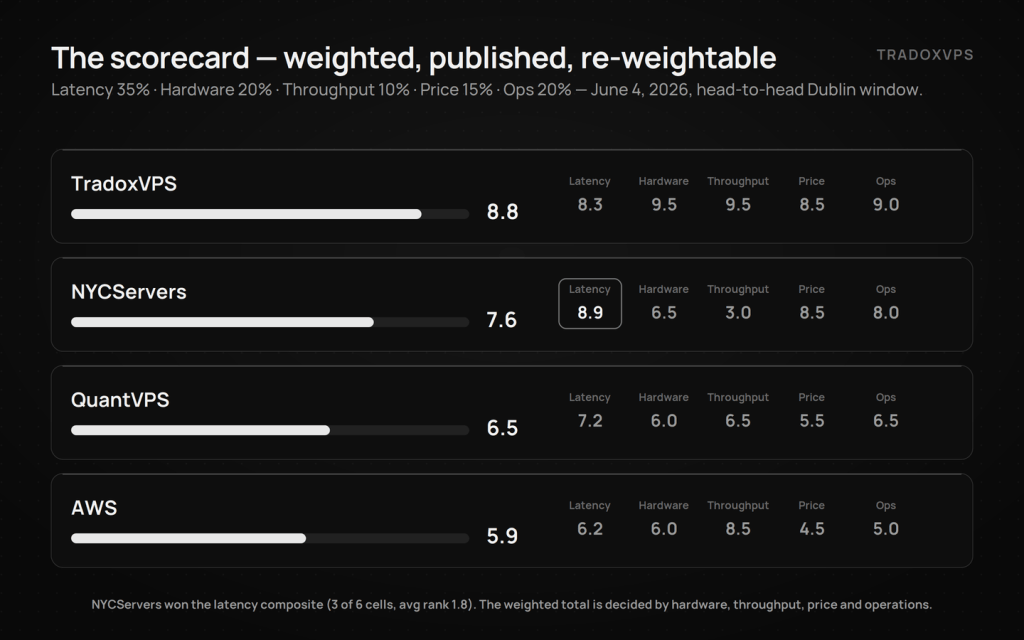
The scorecard — and how the latency score is derived
Weights first, so you can disagree: latency & consistency 35%, hardware 20% (observed, not marketed), throughput & network health 10%, price/value 15% (both cuts), trading operations 20% (deploy speed, OS choice, demo/refund path, support, Polymarket tooling). Location cancelled — all four are in Dublin.
The latency column isn’t vibes — it’s rank math across the six decision cells (feed p50/p99/jitter + order p50/p95/p99). NYCServers won three cells and averaged rank ≈ 1.8 — the composite winner. We won the two order-tail cells and averaged ≈ 2.2, dragged by the field’s worst feed p99. QuantVPS averaged ≈ 2.7, AWS ≈ 3.3. That ordering, scaled, is the column below — and yes, our own weighting (tails matter most) is precisely what keeps us second on it.
| /10 | Latency 35% | Hardware 20% | Throughput 10% | Price 15% | Ops 20% | Weighted |
|---|---|---|---|---|---|---|
| TradoxVPS | 8.3 | 9.5 | 9.5 | 8.5 | 9.0 | 8.8 |
| NYCServers | 8.9 | 6.5 | 3.0 | 8.5 | 8.0 | 7.6 |
| QuantVPS | 7.2 | 6.0 | 6.5 | 5.5 | 6.5 | 6.5 |
| AWS | 6.2 | 6.0 | 8.5 | 4.5 | 5.0 | 5.9 |
Read the first column before anything else: NYCServers beat us on the latency composite. We finish first on the weighted total because of hardware, throughput, value at tier, and operations — and if your weights are “feed latency or nothing,” this table just told you to buy the $25 box, throughput ceiling attached. Publishing a rubric means living with what it returns.
Verdicts — which Polymarket VPS for your bot
TradoxVPS — best overall for serious Polymarket bots, and the order-path tail winner. The only 5.7 GHz DDR5 box in the field, the cheapest serious-bot tier ($44.90), the cleanest DNS measured, full-speed payloads, the tightest order-path tail of the window (never above 40.9 ms in 92 round-trips) — and the worst feed p99 of the field, printed two sections up. That row is on our engineering board, and the fix gets verified publicly: a fresh synchronized re-run of all four providers, with dates. Hold us to it. Trading-first operations throughout: 5-minute deploys, Windows or Ubuntu, a free 3-day demo, location switching.
NYCServers — the latency-composite winner and best budget pick, for event-driven bots only. Fastest feed median, a field-best 18.0 ms feed p95, fastest order median — from a third of our price, on their cheapest tier. The boundary is structural: a ~161 ms payload ceiling flat to ±1.7 ms, a 12.7 ms DNS floor, ~38 ms TLS, DDR4-era silicon even on the $48 tier. Warm sockets and small frames: remarkable value. Bulk data, CPU headroom, or a hot loop that needs clock speed: it hits the wall on request one.
QuantVPS — steady mid-pack, third. Competitive medians, the fastest TLS of the four, nothing broken — and no decision cell won, a ~2× payload penalty, 2019 Cascade Lake silicon where the marketing emphasizes Ryzen, and a $79.99 sticker, the highest flat rate in the field. Solid floor, premium price.
AWS — fourth this window. A quick instance on the cold path (10.6 ms TLS) that trailed where it counts: the loosest order-path p95/p99 of the field and a mid-pack feed. At $0.1292/hour — about $94/month on-demand for the comparable m7a.large, before storage and egress — it’s also the most expensive seat in the comparison. Cloud-native? eu-west-1 is a legitimate home: benchmark every instance you launch (commands above), budget the egress. Otherwise, the metered bill and the ops load are the product. If you’d rather spend the time on your strategy, our bot setup guide covers the flat-rate path end to end.
Limitations — read before quoting the tables
One synchronized evening window, one purchased box per provider, one plan tier each, 88–120 samples per metric — so each p99 is the worst sample or two of its run, which is why p95 and worst samples are printed beside it and why no single-window tail (ours included, in either direction) should be treated as a permanent trait. The three flat-rate boxes started within 8 seconds of each other; the AWS run executed one hour earlier — we print its real time rather than relabeling it, and direct head-to-head claims are strongest among the synchronized trio. No authenticated order test this round; warm /book round-trips are the proxy, per the methodology post. Pricing compares nearest tiers, not identical specs — both cuts and dated screenshots provided. The standing commitments: a second synchronized window to upgrade every “this window” claim to a “reproduced or retracted” claim, quarterly re-benchmarks with dates, and any fix on our side verified only by a fresh public four-provider re-run — never a quiet solo re-test.
Raw data, reproduction, and the standing offer
Reproducing the whole test takes twenty minutes per box: one pip install, one script, any provider — including the ones we sell. The walkthrough lives in How to test the latency of your Polymarket VPS. If your numbers disagree with ours, send them; corrections get published with a date on them.
Frequently Asked Questions
On our published weighted rubric: TradoxVPS overall (8.8/10), NYCServers for budget event-driven bots (7.6), QuantVPS (6.5), AWS (5.9). On the pure latency composite, NYCServers won. Both sentences are true; the tables above let you re-weight for your own bot.
Yes. NYCServers took the feed table and the latency composite, and our box printed the worst feed p99 of the field. A benchmark you’d only publish if you won isn’t a benchmark.
From Dublin, all four boxes saw the live feed in ~13–15 ms median and round-tripped the order book in ~21–23 ms. The medians barely differ — what differs is tails (37 to 55 ms at order-path p99) and throughput (up to 8×). Optimize p99 and jitter, not the median, and never trust a marketing “1 ms.”
This page publishes what’s been measured, when it was measured — and one synchronized window beats a stack of un-synchronized anecdotes. A second window is already committed (it upgrades every claim here to “reproduced or retracted”), and this page re-benchmarks quarterly with dated updates.
For a single event-driven bot on warm connections — this data says yes, and the numbers were earned on that exact cheap tier. The structural caveats: a ~161 ms payload ceiling, 2 GB RAM, a 12.7 ms DNS floor, slow TLS. Snapshot-pullers and multi-strategy bots will outgrow it immediately.
You can — this instance had a quick cold path. You’re paying ~2× the specialist price at the comparable tier, plus storage and per-gigabyte egress, plus spec variance across instance families and launches, plus the tuning work. Fine if that’s your day job; expensive in money and time if it isn’t.
lscpu | grep -E 'Model name|CPU family' on any Linux box — compare against the product page. On AWS, the IMDS command in the Hardware section returns the exact instance type. We published our boxes’ outputs; ask your provider to match that.
That’s the design: download the four JSONs, run the same public script on any box, compare. The methodology is public, the script is public, and this page gets re-benchmarked quarterly with dated updates.
All measurements June 4, 2026 (evening window; AWS one hour earlier, disclosed), one purchased instance per provider. Networks, fleets, and prices change; re-test before committing capital. We operate TradoxVPS. Latency varies with network conditions, market activity, and configuration.