
Most VPS providers ask you to take their performance claims on faith. You should not. Performance is something you can measure yourself in a few minutes, and knowing how your VPS actually performs, not how a sales page says it performs, is what separates a setup you can trust with real money from one you are guessing about.
This guide shows you exactly how to check a VPS properly: CPU, memory, disk, network latency, and uptime, using practical, repeatable tools that anyone can run. It matters most for trading platforms and automated strategies, where a slow or inconsistent machine costs you directly, but the same methods apply to any always-on application.
And we did not just describe the tests. We ran every one of them on our own plans and published the real results below, screenshots included, so you can see what genuine performance looks like and hold any provider, including us, to the same standard.
1. Prepare Your VPS for Accurate Testing
Good measurements depend on testing under the right conditions. Before you run anything:
- Log in to your VPS via Remote Desktop (Windows)
- Close unnecessary applications and background tasks
- Ensure no platform updates or maintenance tasks are running, since those distort any result.
- Run tests during normal workload hours, not just idle time, and ideally repeat during busy market hours.
- Note your VPS location (e.g., Chicago), so latency and routing results are meaningful.
⚠️ Performance tests should reflect real usage conditions, not best-case scenarios.
2. How to Test CPU Performance on a VPS
CPU performance is one of the most important factors in overall VPS responsiveness, especially for trading platforms, real-time charting, and automated strategies. In this section, we cover two reliable ways to evaluate CPU performance on a Windows-based VPS.
Method A: Basic CPU Monitoring (Windows)
Open Task Manager (press Ctrl + Shift + Esc, or right-click the taskbar and choose Task Manager). Click Performance, then select CPU.
Pay attention to these indicators:
- Base speed vs current speed: confirms whether the CPU is running at expected frequencies.
- Utilization during workload: watch how usage changes when platforms, charts, or strategies are active.
- Frequency stability: observe whether the clock speed stays steady or fluctuates frequently.
What to look for:
- Stable clock speeds under sustained load
- No frequent drops caused by throttling
- Smooth responsiveness when running multiple tasks or platforms at once
Warning: If clock speeds drop sharply while CPU usage is high, it may indicate CPU throttling, oversubscription, or power and thermal limitations. This is common with low-quality or heavily shared VPS environments.
Method B: CPU Benchmark Test (Recommended)
Basic monitoring shows behavior, but a benchmark gives you measurable performance data. A benchmark helps you evaluate raw CPU processing capability, single-thread responsiveness, multi-thread consistency, and the effects of CPU oversubscription.
For a trading VPS, consistent single-thread performance matters more than peak multi-core scores, because most trading platforms and strategies lean on one core for live work. Keep that in mind when you read your results.
Step 1: Download the PassMark PerformanceTest tool
PassMark is a widely used, industry-recognized benchmarking tool.
- Visit https://www.passmark.com/products/performancetest/download.php
- Download the Windows version. Most trading VPS environments run Windows Server, which is fully supported.
Step 2: Install the software
Double-click the installer, click Next through the setup steps, and complete the installation. No advanced technical knowledge is required.
Step 3: Run the benchmark
Open PerformanceTest and click Run Benchmark (or Run All Tests). PassMark automatically tests CPU arithmetic, compression and decompression, encryption workloads, memory latency, disk read/write speed, and basic graphics rendering. The full test typically takes about 5 minutes. For a clean baseline number, avoid running other applications during the test.
Step 4: Check your CPU Mark and Single Thread Rating
After completion, note two numbers: your overall CPU Mark score, and your Single Thread Rating (PassMark reports this separately). For a trading VPS, the Single Thread Rating is the more important of the two, because live execution, indicator calculations, and chart updates depend heavily on single-core speed. A strong single-thread result generally means more responsive platforms and smoother charting.
Step 5: Compare your results with real hardware
PassMark lets you compare your VPS against modern desktop CPUs, enterprise server CPUs, other VPS environments, and historical benchmark data. This tells you whether your VPS performs like a modern high-performance Ryzen system, or like an outdated, oversold CPU often found in low-quality hosting. This step is what separates real performance from marketing claims, so do not skip it.
Example: TradoxVPS CPU Benchmark Transparency
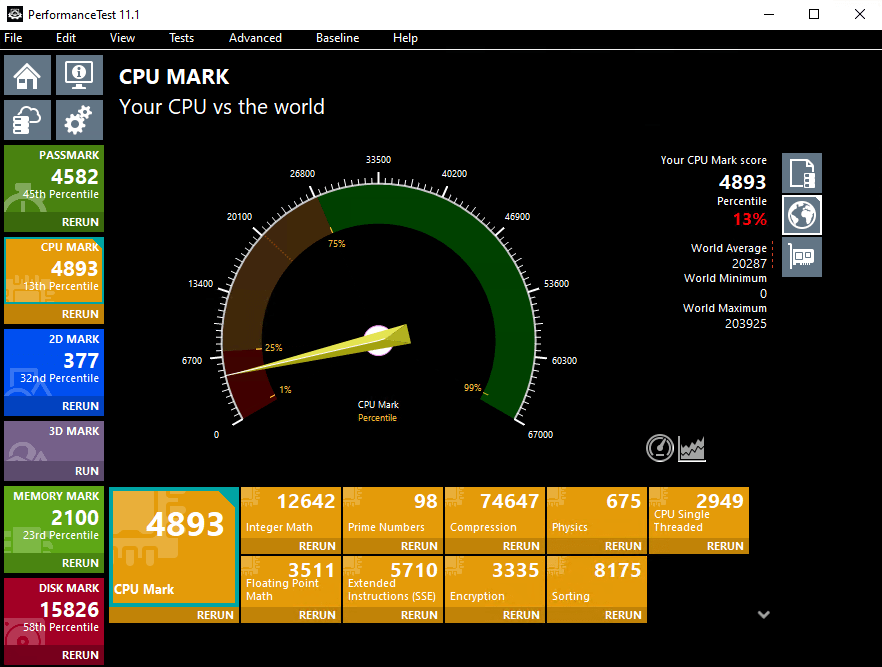
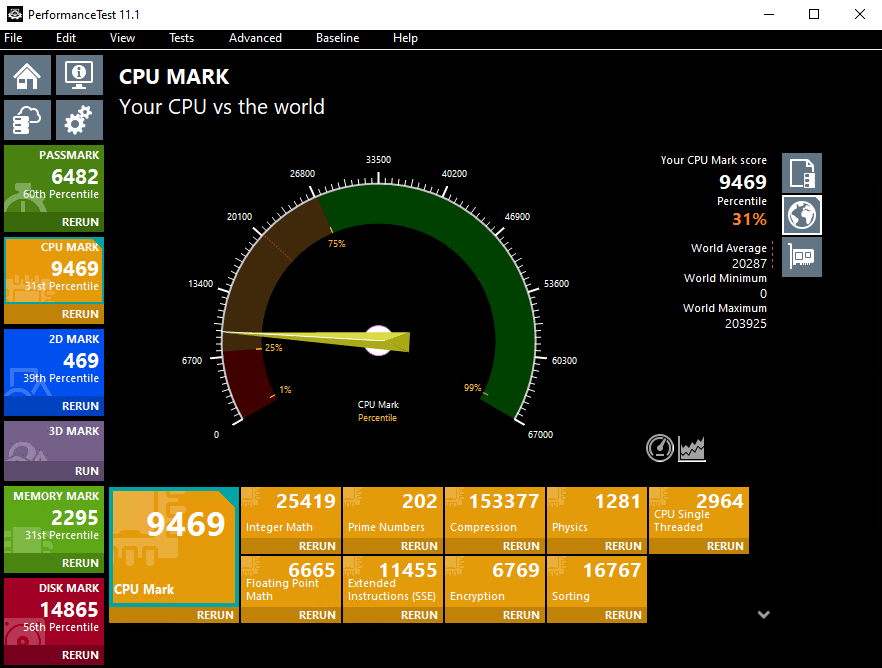
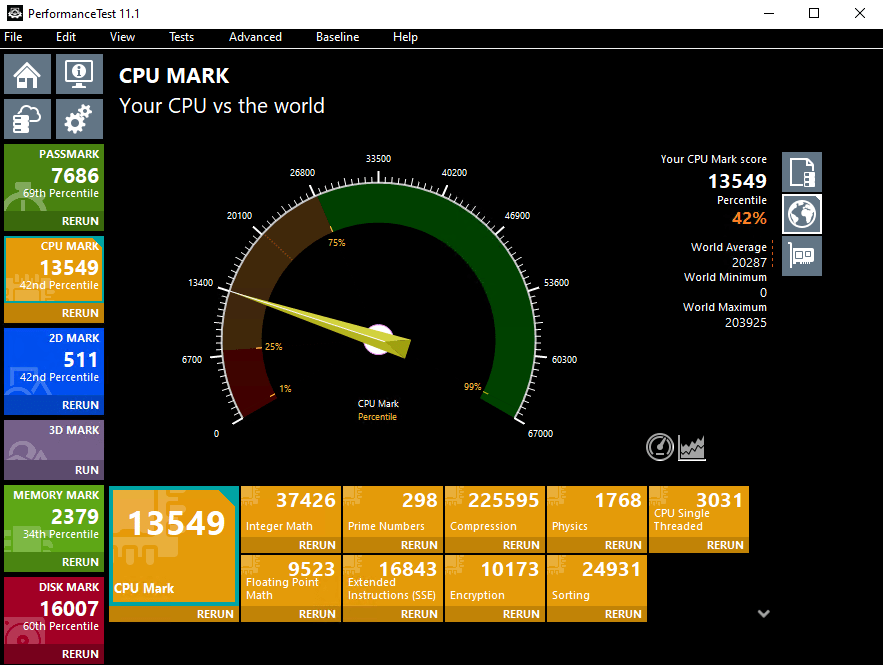
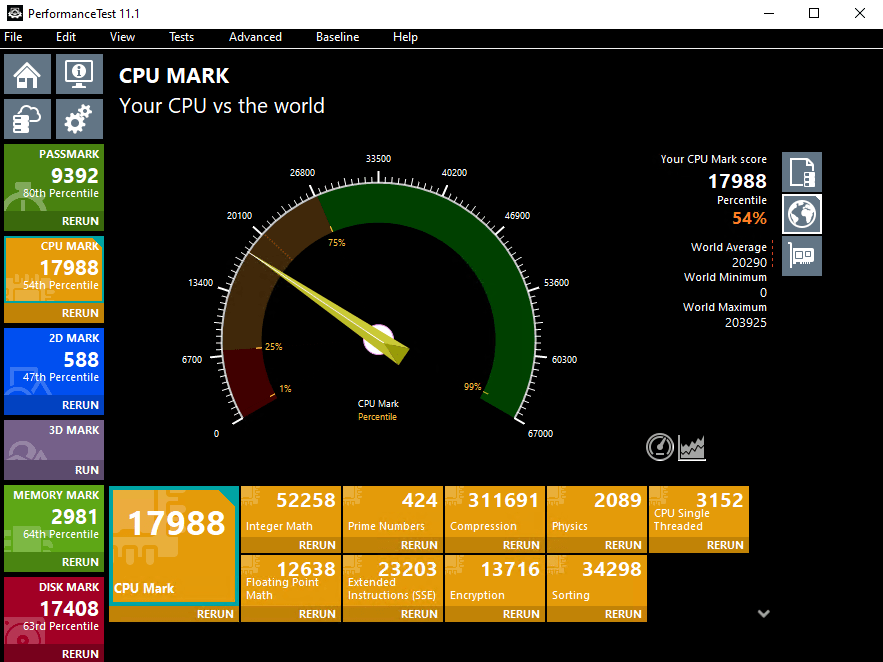
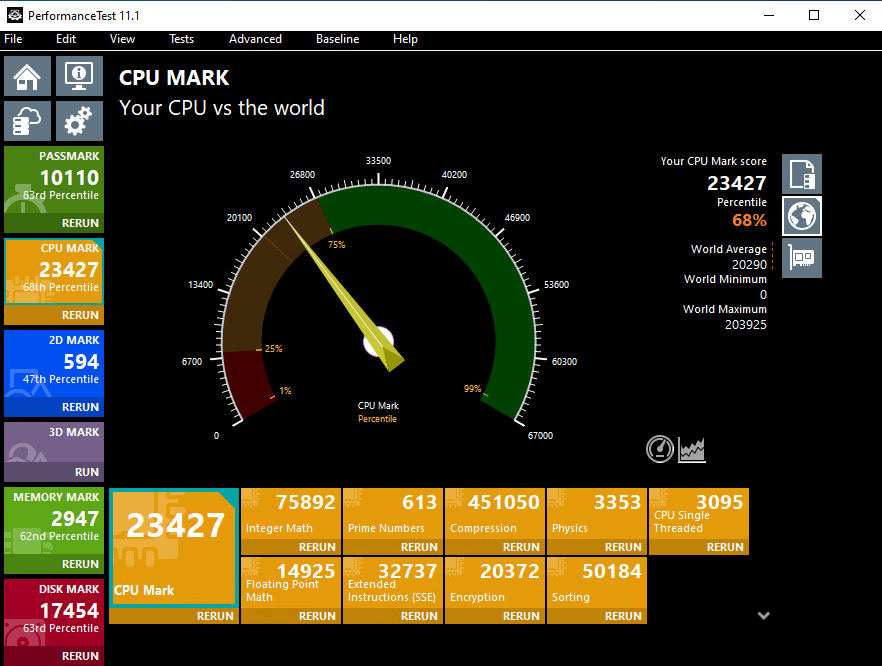
To provide transparency, TradoxVPS publishes real benchmark scores for each VPS tier:
TradoxVPS Starter Trader VPS Plan’s Passmark Score
TradoxVPS Active Trader VPS Plan’s Passmark Score
TradoxVPS Advanced Trader VPS Plan’s Passmark Score
TradoxVPS High Performance VPS Plan’s Passmark Score
TradoxVPS Ultra Low Latency VPS Plan’s Passmark Score
TradoxVPS Max Performance VPS Plan’s Passmark Score
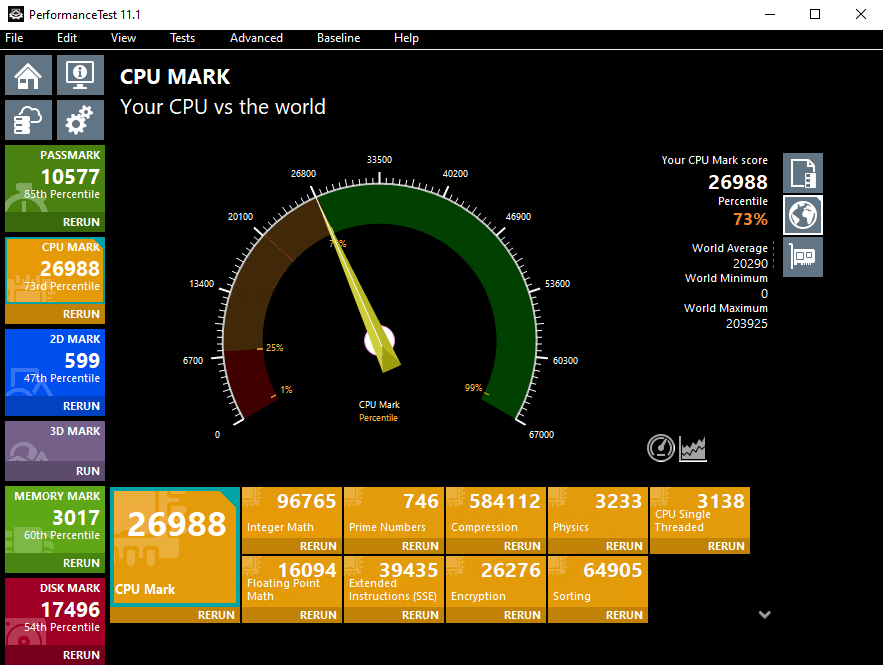
These benchmarks allow users to evaluate CPU performance before deployment, supporting informed decision-making.
How to interpret your benchmark results
A single benchmark number is a snapshot, so use it as a trend indicator, not absolute truth. Run the test at least twice, and ideally compare results over days and weeks, since a stable score over time tells you far more than one high reading. When comparing against other machines or providers, do not compare different locations unfairly, because latency and routing differ by region. What you are really looking for is consistency: a VPS that scores the same under repeated testing is more trustworthy than one that posts an occasional high number and then drops under load.
3. How to Check VPS Memory Performance
Basic Memory Check
Open Task Manager, go to Performance, then Memory. Review your total available RAM, how much is in use, and the split between cached and free memory.
What to look for:
- Enough headroom for peak workloads
- No constant memory pressure
- Smooth application switching
Advanced Memory Validation
Beyond the basics, confirm the following, and here is how to check each on Windows:
- Memory type and speed (DDR4 vs DDR5). In Task Manager, the Memory tab shows the speed and, on most systems, the form and type. For full detail, open Command Prompt and run
wmic memorychip get Speed, MemoryType, Capacity. This confirms you are getting the generation and speed you expect. - No excessive swapping or paging. In the Memory tab, watch the “Committed” figure and paging activity while your platforms are running. If the system is constantly paging to disk, you are short on RAM, which causes stalls at the worst moments.
- Stable performance during multi-platform use. Open your normal platforms, charts, and strategies together and confirm memory use stays within headroom rather than climbing toward the limit.
One thing worth keeping in perspective: for trading, how much RAM you have matters more than whether it is DDR4 or DDR5. Running out of memory forces the system to page to disk and causes freezes, while the generation difference is barely felt on a single strategy. Size your RAM to your actual workload first.
Note: Memory bottlenecks usually cause freezes and stalls rather than outright crashes, so smooth, headroom-comfortable memory use is what you are aiming for.
4. How to Test VPS Disk Performance (NVMe vs SSD)
Disk performance directly affects platform startup time, log file access, and historical data loading. It does not affect your live order execution, which runs through the CPU and network, so treat storage as a data-and-recovery advantage rather than an execution-speed one.
Disk Speed Test (Windows)
Use CrystalDiskMark, a free and widely used disk benchmark. Download it, run the default test on your VPS, and note three things:
- Sequential read/write speed: how fast large, continuous files move.
- Random 4K performance (IOPS): small, scattered operations, which affect responsiveness the most.
- Consistency under load: run the test a few times and watch for large swings.
What good results look like:
- Real local NVMe shows sequential reads in the thousands of MB/s and random 4K performance in the hundreds of thousands of IOPS.
- Throughput stays stable across repeated runs, without sudden drops.
Warning: If a VPS advertised as NVMe benchmarks like a SATA drive (around 550 MB/s), or if performance fluctuates heavily or collapses under sustained load, the storage may be shared, oversold, throttled, or network attached despite the “NVMe” label. Consistency across repeated runs is the real test.
5. How to Test Latency
Latency is the metric traders care about most, and also the one most people test incorrectly. A basic ping is a good starting point, but it does not measure what actually matters for trading. Here is how to do both.
Basic Latency Test (Ping)
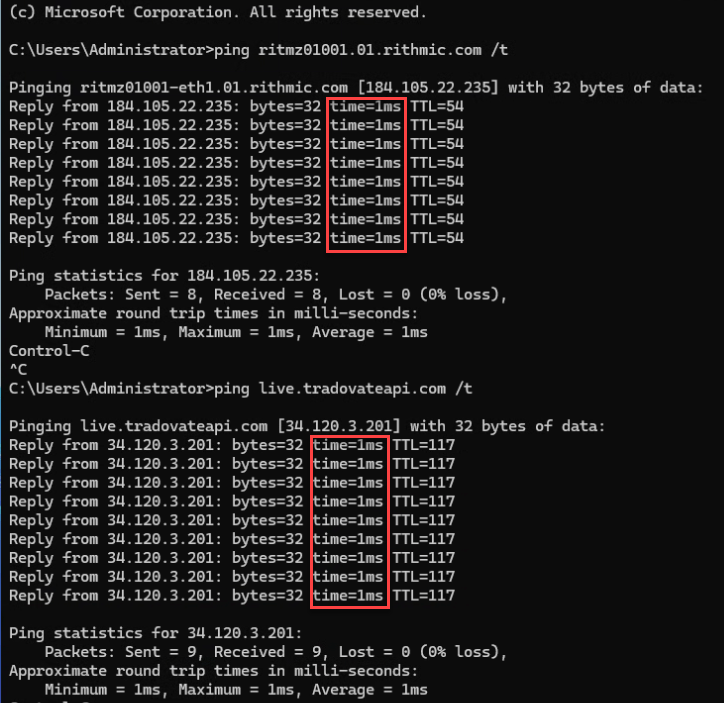
Open Command Prompt and run a ping to your target service (broker, data feed, or a nearby endpoint). Observe the average latency in milliseconds, any packet loss, and any latency spikes.
Ping is a useful quick check, but treat it as a smoke test, not a real trading latency measurement. It uses ICMP, which routers often deprioritize and which many brokers and exchanges do not even answer. You also do not connect directly to the exchange; your platform connects to your broker’s gateway, which then routes to the exchange, so pinging the exchange tests the wrong path. And ping only shows an average, hiding the spikes and inconsistency that matter most for trading.
Proper Latency Test (TCP to your broker gateway)
To measure the path your orders actually take, test the TCP round trip to your broker or data-feed gateway, not to the exchange.
Find the host and port your platform connects to. It is in your data feed or connection settings, for example your Rithmic gateway. Then, on Windows Server, use a TCP-based tool instead of ICMP ping:
- tcping measures TCP connect time to a specific port. Run:
tcping -n 50 your-broker-host your-port - psping (from Microsoft Sysinternals) does the same and shows a latency histogram. Run:
psping -n 100 your-broker-host:your-port
Look at the minimum, average, and maximum. A tight spread between them is what you want, because a low average with a high maximum means the inconsistency that hurts trading.
To see jitter and packet loss along the route, use WinMTR. It shows latency and loss at every hop, so you can spot where a problem enters the path. And read your platform’s own latency indicator: NinjaTrader, Sierra Chart, and Rithmic all display a live ping to the data feed. That is the most real number, because it is measured to the exact gateway you trade through.
Extended Network Stability Test
Run your tests across different times of day, during peak market hours, and during high-volatility periods. What matters most is consistency, not just low averages, along with minimal jitter and no packet loss. For futures trading, Chicago-hosted VPS environments typically provide the most stable routes to CME infrastructure.
One honest note
Even a good round trip to your broker’s gateway is the network leg to your broker, not your full execution round trip to the matching engine, and not your actual fill. It is the best number you can measure directly, and far more meaningful than a plain ping to a generic host, but the only fully real measure is how your orders actually fill. Judge a VPS by a proper TCP round trip to your own broker, measured during market hours and checked for consistency, not by a single advertised ping figure, including ours.
6. Upload & Download Speed Test (Application-Based)
Upload and download speed testing confirms that your VPS network is not bandwidth limited and performs consistently. It is worth being clear up front, though: bandwidth is the least important metric for trading. Trading platforms and bots send small messages, so raw download and upload speed matters far less than latency and its consistency. Run this test only to confirm you are not bandwidth limited or badly misconfigured, not as a measure of trading performance.
For high-performance VPS environments, application-based testing is more accurate than browser tests, especially when speeds exceed 1 Gbps. Browser-based tests often fail to fully utilize fast VPS networks, which is why we recommend the Ookla Speedtest application.
Step 1: Install the Speedtest app
Inside your VPS, go to https://www.speedtest.net/apps, download the Windows application, and install it using the default settings. This works on Windows Server VPS environments.
Step 2: Run the speed test
Open the Speedtest app, select a nearby high-capacity test server, and click Go. Let the test complete fully, and run it two or three times to confirm consistency.
Step 3: Check your results
Note your download speed, upload speed, ping, and jitter (if shown). For a professional VPS, speeds should be stable with no sudden drops. Consistency matters more than a high peak reading.
Example: TradoxVPS Speed Test Results
To maintain transparency, TradoxVPS publishes real speed test results measured using the Ookla application.
7. How to Verify VPS Uptime
Uptime is critical for trading and automated systems, because a strategy that stops mid-position leaves your risk unmanaged. Monitor for unexpected reboots, network interruptions, and platform disconnects.
You can verify uptime yourself rather than take a claim on faith:
- Check the provider’s public status page for real availability history, incidents, and maintenance notices.
- Point an external monitor at your VPS, such as UptimeRobot, to independently log its uptime over time.
- Check Windows Event Viewer for unexpected shutdowns. Event ID 6008 marks an unexpected shutdown, which is a clear signal of an unplanned reboot.
Reliable providers publish uptime statistics, incident history, and maintenance notices. Treat any published uptime figure, including ours, as a target to verify against real data, not a guarantee. Without transparency, an uptime claim cannot be checked.
Conclusion
Checking VPS performance correctly means understanding how CPU, memory, disk, network, and uptime work together, and measuring each rather than assuming. For professional workloads, consistency beats peak performance every time. A well-built VPS should provide both strong performance and the data you need to validate it, and the tools in this guide let you confirm that for yourself, on any provider you are considering.
Frequently Asked Questions
No. Ping is a useful quick check, but it measures ICMP round trip to a host, which routers deprioritize and many brokers and exchanges do not answer, and it only shows an average. For trading, measure the TCP round trip to your actual broker’s gateway (with tools like tcping or psping), check jitter and packet loss with WinMTR, and read your platform’s built-in latency indicator, all during market hours.
Find the host and port your platform connects to, then run a TCP latency test to it (tcping or psping on Windows) rather than an ICMP ping. Look at the spread between minimum and maximum, not just the average, because consistency is what matters. Use WinMTR to see where any jitter or loss enters the path, and note your platform’s own latency reading during a busy session.
Watch for inconsistency under load, which is the signature of a shared or oversold host. Run a CPU benchmark several times and during busy periods: if the score or the CPU’s clock speed drops noticeably under load, resources are likely contended. Do the same for disk: run a storage benchmark repeatedly and watch for large swings. Steady results across repeated runs indicate healthy allocation; big fluctuations suggest oversubscription.
For trading, the single-thread rating matters far more than the overall multi-core score, because most trading platforms and strategies lean on one core for live execution. Prioritize a high single-thread PassMark rating from a modern CPU over a high core count. Compare a provider’s published benchmark against an independent PassMark run on the actual VPS, and value consistency across runs as much as the headline number.
Use CrystalDiskMark on Windows and run the default test. Real local NVMe should show sequential reads in the thousands of MB/s and random 4K performance in the hundreds of thousands of IOPS. If a VPS advertised as NVMe benchmarks like a SATA drive, around 550 MB/s, or if performance collapses under sustained load, the storage may be shared, throttled, or network attached despite the label.
Less than most people think. Trading platforms and bots send small messages, so a fast download or upload speed is the least important metric for trading. A speed test is worth running only to confirm you are not bandwidth limited or badly misconfigured. Latency and its consistency matter far more than raw bandwidth.
Test when you first set up the VPS to establish a baseline, again any time you notice slow performance or execution issues, and periodically, for example monthly, to catch gradual degradation. Testing during different times, including busy market hours, gives a truer picture than a single quiet-hours run.
Disclaimer: The benchmark scores, latency figures, and speed-test results shown on this page reflect our own testing on specific plans at a specific time, and are provided for transparency and as a guide to how you can verify performance yourself. Your own results will vary depending on plan, configuration, network conditions, the tools you use, and the time you test. Latency figures represent the network leg to a given endpoint, not your full order execution or fill. TradoxVPS provides infrastructure only and does not provide investment or trading advice. Trading involves substantial risk of loss.